
You spent $50,000 on training last quarter. Leadership wants to know what the company got back. "Better skills" and "improved morale" won’t cut it, you need a number. That’s where the training ROI formula comes in: a straightforward calculation that turns your training spend into a concrete percentage your stakeholders actually care about.
Most L&D professionals know ROI matters, but few calculate it consistently. The reasons are understandable, isolating training’s impact from other variables is tricky, gathering the right data takes effort, and the formula itself can feel deceptively simple until you sit down to plug in real numbers. But skipping this step means flying blind on budget decisions and losing credibility when it’s time to defend or expand your training programs.
This guide breaks down the exact formula for calculating training ROI, walks through each component step by step, and shows you how to apply it with real examples. You’ll learn how to identify and quantify both costs and benefits, avoid the most common measurement mistakes, and present your results in a way that resonates with decision-makers. We also cover how tools like Axis LMS, Atrixware’s learning management system, give you the built-in reporting and tracking data you need to make accurate ROI calculations possible in the first place, rather than relying on guesswork after the fact.
What training ROI means and why it matters
Training ROI is the financial return your organization receives from an investment in a learning program, expressed as a percentage. The core idea is straightforward: you compare the net monetary benefit of training against its total cost. If the benefits outweigh the costs, you have a positive ROI. If they don’t, you have a precise number that tells you how far off you are and where to course-correct. ROI is not a vague measure of learner satisfaction or course completion rates. It is a concrete, dollar-based metric that puts training in the same financial language your leadership team already uses to evaluate every other business initiative.
ROI versus other training metrics
Most organizations track training metrics like completion rates, quiz scores, and learner satisfaction scores, often pulled from a post-course survey. These measures are useful for monitoring engagement, but they do not tell you whether training actually moved the business forward. ROI goes one level deeper by asking a harder question: did this training produce measurable, monetizable outcomes for the organization?
The difference matters because completion rates do not justify budget requests. A 95% course completion rate is a process metric. A 240% ROI on a sales training program is a business outcome. When you present the latter to a CFO, the conversation shifts from "did people finish the course?" to "how do we scale this?" That shift is what transforms the L&D function from a cost center into a strategic driver.
Tracking completion without tracking ROI is like tracking how many miles you drove without checking whether you arrived at your destination.
Why leadership demands a number
Budget pressure has pushed learning and development professionals to prove their programs earn their keep. Companies face tighter margins, leaner headcounts, and more scrutiny over every line item. When budget cuts come, training budgets are often the first target because they lack a clear financial justification tied to business outcomes. Saying "employees found it valuable" is not enough when every department head is presenting hard numbers.
The training ROI formula gives you that justification. It forces you to connect a program to a specific business result, whether that is reduced errors, faster onboarding, higher sales conversion rates, or lower turnover. Once you can show that a $30,000 training program produced $90,000 in measurable business value, training stops being an expense and becomes an investment your leadership actively protects.
What counts as ROI-worthy training
Not every training program requires a full ROI analysis. Short onboarding modules or a mandatory annual compliance refresher may not justify the measurement effort involved. ROI analysis delivers the most value for programs that are costly, repeated at scale, or tied directly to a performance problem you are actively trying to solve. Strong candidates include a company-wide sales skills program, a customer service initiative aimed at reducing churn, or a technical upskilling program targeting a specific drop in production quality.
When you choose programs where the performance gap is clear and the business stakes are high, the calculation becomes more straightforward and the results become more compelling to stakeholders. The goal is not to calculate ROI on every piece of content in your catalog. It is to be deliberate about which programs warrant the investment in measurement and then execute that measurement rigorously.
The training ROI formula and key variations
The training ROI formula gives you a single percentage that shows how much financial return your organization generated for every dollar spent on a learning program. Before you apply it correctly, you need to understand both the standard version and the two most useful variations. Each version answers a slightly different question, so knowing when to use which one keeps your analysis accurate and your reporting credible to both finance and leadership.
The core ROI formula
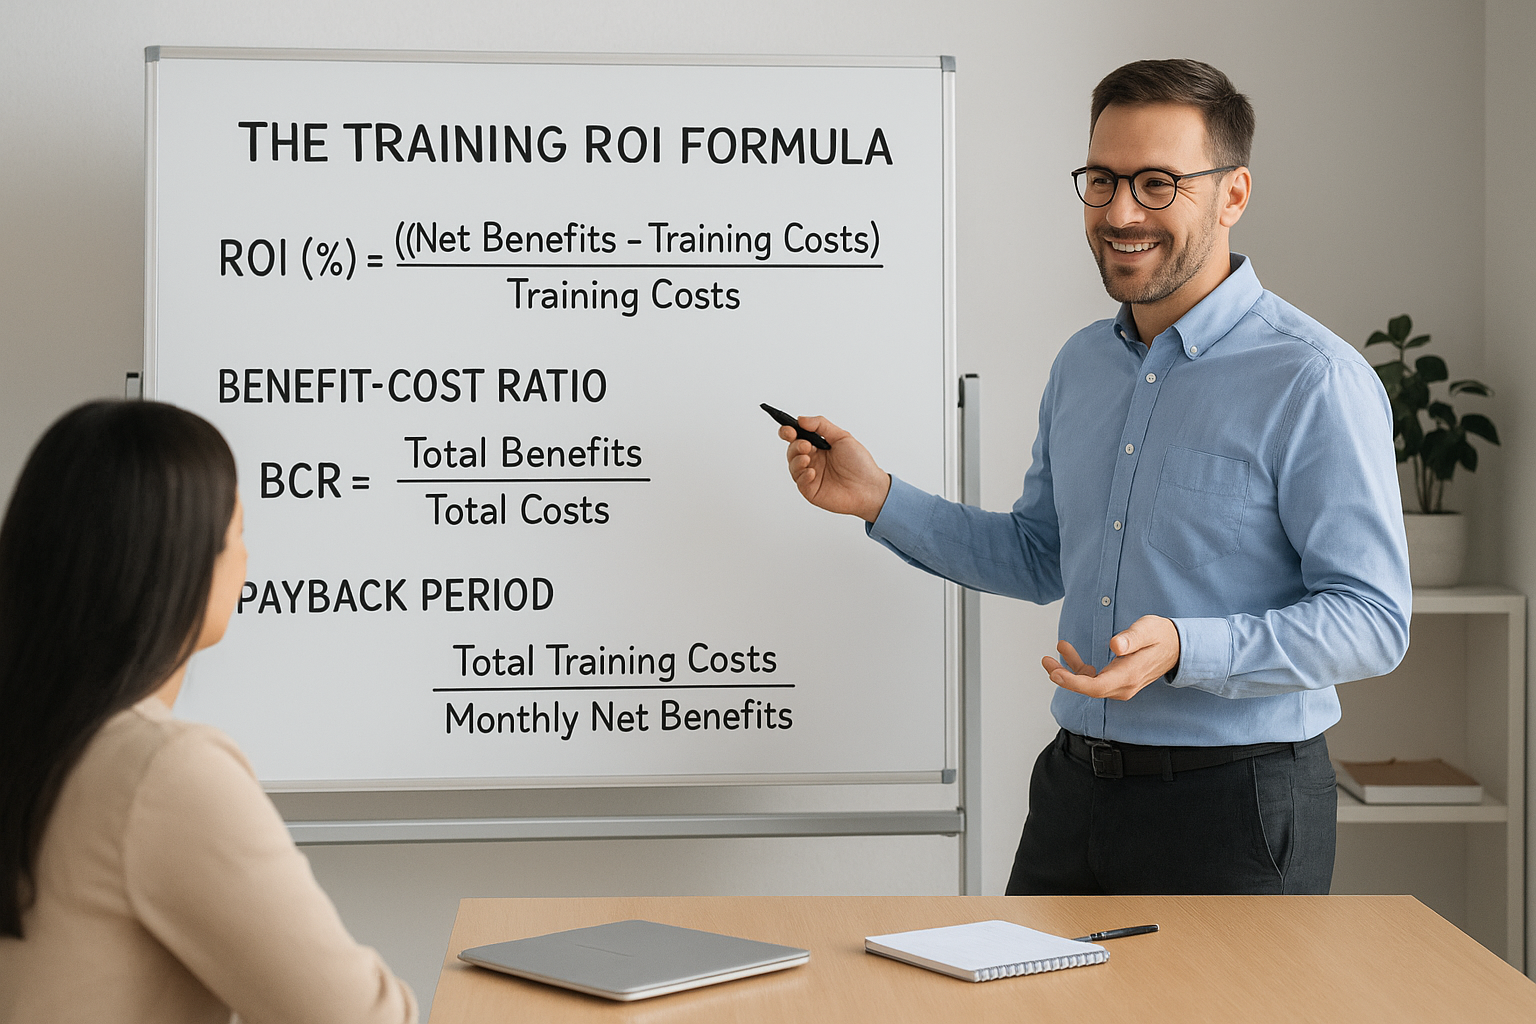
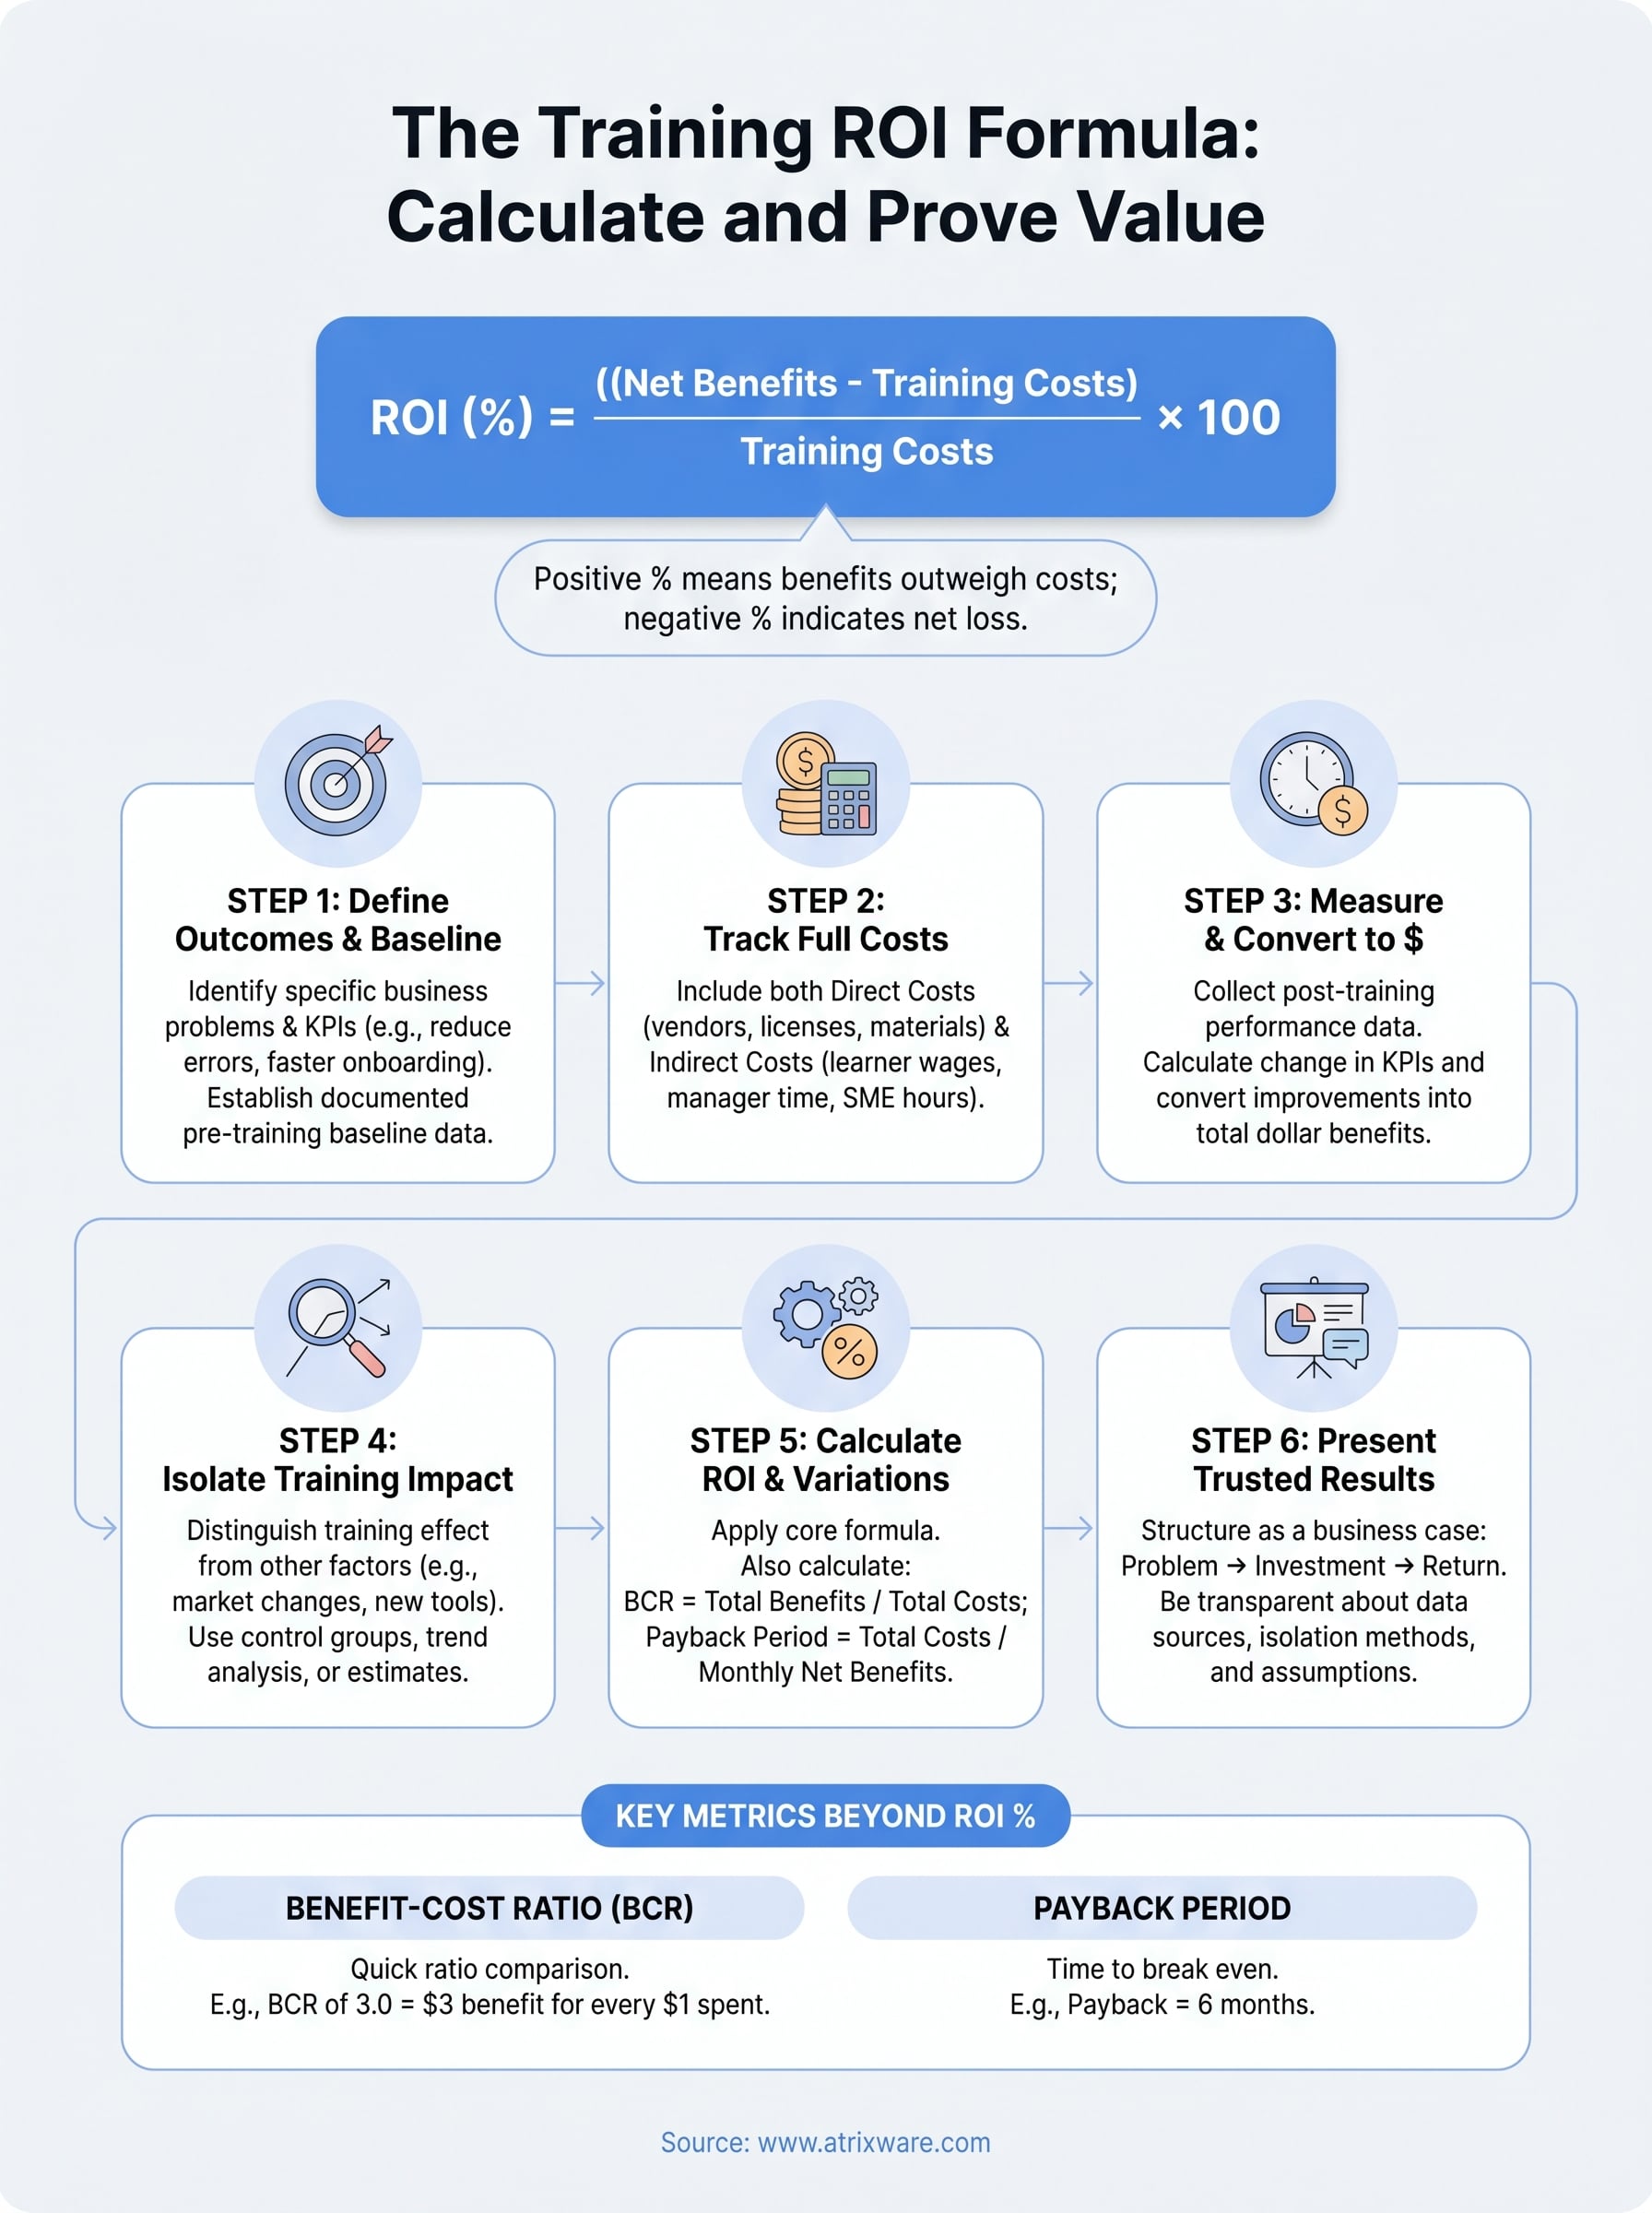
The standard formula is:
ROI (%) = ((Net Benefits – Training Costs) / Training Costs) × 100
"Net benefits" equals the total measurable financial gains produced by training minus the total costs. If a sales training program generated $90,000 in incremental revenue and cost $30,000 to design and deliver, your net benefit is $60,000. Divide that by $30,000, multiply by 100, and you get a 200% ROI. That means for every dollar invested, the program returned two additional dollars on top of recovering the original cost.
A positive ROI percentage means the program returned more than it cost; a negative percentage tells you exactly how much value you still need to recover to break even.
Two variations worth tracking alongside ROI
The core formula works well for direct comparisons, but two additional metrics give you a more complete picture of program value.
The Benefit-Cost Ratio (BCR) compares total benefits to total costs without subtracting first:
BCR = Total Benefits / Total Costs
A BCR of 3.0 means you received $3 in benefit for every $1 spent. Use this when stakeholders want a quick, intuitive ratio rather than a percentage.
Payback period tells you how long it takes for benefits to fully recover the training investment:
Payback Period = Total Training Costs / Monthly Net Benefits
If your compliance training cost $24,000 and saves $4,000 per month in error-related rework, your payback period is six months. This metric is especially useful for justifying large upfront costs on programs where returns accumulate gradually over time.
| Metric | Formula | Best Used When |
|---|---|---|
| ROI (%) | (Net Benefits / Costs) × 100 | Comparing programs head-to-head |
| BCR | Total Benefits / Total Costs | Quick executive summaries |
| Payback Period | Costs / Monthly Net Benefits | Justifying large upfront investments |
Step 1. Define outcomes, KPIs, and a baseline
Before you plug any numbers into the training ROI formula, you need to know what you are measuring and where you started. This step is the foundation of the entire calculation. Skipping it or doing it loosely after training ends is one of the most common reasons ROI analyses fall apart under scrutiny. You cannot credibly claim a $60,000 improvement if you never recorded what the number looked like before training began.
Choose outcomes tied to a specific business problem
Every training program you want to measure should connect to a single, identifiable performance gap. Start by asking: what business problem prompted this training? The answer determines which outcome you track. Avoid vague goals like "improve customer service." Instead, define the outcome precisely:
- Reduce average handle time in the call center from 8.2 minutes to 6.5 minutes
- Increase new hire ramp time from 90 days to 60 days
- Cut order processing errors from 4.3% to under 2%
Specific outcomes like these give you a clear target and make it obvious whether training moved the needle.
Set KPIs that convert to dollars
Once you have your outcome, choose one to three KPIs that directly represent it in measurable terms. The best KPIs for ROI purposes are ones you can eventually convert to a dollar value, because the formula requires financial figures, not percentages or satisfaction scores.
A KPI only works for ROI if you can answer the question: "What is one unit of improvement worth in dollars?"
For example, if your KPI is error rate, calculate the average cost per error in rework time, materials, and customer recovery. If your KPI is employee turnover, use your organization’s cost-per-hire data. Tying each KPI to a dollar value upfront makes Step 3 significantly easier.
Establish a documented baseline
Your baseline is the pre-training measurement of each KPI. Capture it as close to the training start date as possible, using at least four to eight weeks of data to smooth out natural variation. Document the source, the time period, and who verified the number.
Use this simple template to record your baseline:
| KPI | Baseline Value | Data Source | Date Range | Owner |
|---|---|---|---|---|
| Error rate | 4.3% | QA system | Apr 1 – May 31 | QA Manager |
| Handle time | 8.2 min | CRM report | Apr 1 – May 31 | Support Lead |
Documented baselines give your final ROI calculation credibility that a retrospective estimate simply cannot match.
Step 2. Track the full cost of training
Undercounting your training costs is one of the fastest ways to inflate your ROI and lose credibility when someone audits your work. The training ROI formula only produces trustworthy results when your cost figure is complete and documented, not just the invoice from a vendor or the license fee for a platform. You need to account for every resource the program consumed, including the time your internal team spent building and delivering it, before you calculate anything.
The two categories of training costs
Training costs fall into two buckets: direct costs and indirect costs. Direct costs are the obvious line items you can pull from a purchase order or a budget report. Indirect costs are the ones most organizations forget, and they often represent a significant share of the total investment. Leaving them out skews your calculation and makes your reported ROI look better than it actually is.
Direct costs include:
- Content development or vendor fees
- LMS licensing and platform fees
- Facilitator or instructor fees
- Materials, printing, or equipment
- Travel and venue expenses for in-person delivery
Indirect costs include:
- Learner time away from regular work (hourly wage multiplied by training hours)
- Manager time spent coordinating or supporting the program
- IT setup and administration time
- Internal subject matter expert hours contributed to content development
If you leave out learner wages, you could be ignoring the single largest cost in your entire training budget.
A cost-tracking template you can use
Use this template at the start of every program you plan to measure. Fill it in as costs are incurred so you work with actual figures rather than estimates pieced together after the fact.
| Cost Category | Description | Amount ($) |
|---|---|---|
| Content development | Vendor fee or internal hours × hourly rate | |
| LMS / platform | License or per-seat fee | |
| Facilitator / instructor | External fee or internal hours × rate | |
| Materials | Printing, tools, software licenses | |
| Travel and venue | If applicable | |
| Learner time | Total training hours × avg. hourly wage × number of learners | |
| Manager coordination | Hours × manager hourly rate | |
| SME contributions | Hours × subject matter expert hourly rate | |
| Total Training Cost |
Completing this table before you run your numbers gives you a defensible cost figure that holds up in any executive review. When your stakeholders see that you captured both direct and indirect expenses, your entire ROI calculation carries far more weight.
Step 3. Measure results and convert them to dollars
Once training ends, you move from planning to measuring. This is where the training ROI formula starts to produce real numbers. Your goal in this step is to collect post-training performance data for each KPI you established in Step 1, then translate every improvement into a dollar figure you can plug directly into your ROI calculation.
Collect post-training performance data
Give your learners enough time to apply what they learned before you measure. Most programs need four to twelve weeks of post-training data to show meaningful change. Pulling numbers one week after training ends often reflects novelty rather than genuine skill transfer, and that will undermine your credibility with stakeholders who know how performance data works.
Pull your post-training data from the same sources you used for your baseline: your CRM, your QA system, your HR platform, or your LMS reporting dashboard. Consistency in your data source matters. If your baseline came from your call center’s average handle time report, your post-training measurement needs to come from that exact same report, covering the same time of day, team composition, and call volume conditions where possible.
The most credible ROI analysis uses data collected under the same conditions before and after training, not data pulled from different systems or time periods.
Convert performance improvements to dollar values
Once you have your post-training figures, calculate the change in each KPI by subtracting the baseline value from the new measurement. Then multiply that change by the dollar value you assigned to each unit of improvement back in Step 1. This multiplication is how you turn a performance shift into a financial benefit.

Use this conversion framework to work through each KPI systematically:
| KPI | Baseline | Post-Training | Improvement | Dollar Value per Unit | Total Benefit ($) |
|---|---|---|---|---|---|
| Error rate | 4.3% | 1.9% | 2.4 percentage points | $210 per error avoided | Errors avoided × $210 |
| Handle time | 8.2 min | 6.4 min | 1.8 min per call | $4.20 per minute saved | Minutes saved × $4.20 × call volume |
| New hire ramp | 90 days | 65 days | 25 days sooner | $380 per day of productivity gained | 25 × $380 × number of new hires |
Add the total benefit figures across all KPIs to get your gross benefit number. That number feeds directly into the numerator of your ROI formula in Step 5.
Step 4. Isolate training impact from other factors
Collecting post-training performance data is not enough on its own. Your sales numbers might have improved because a new product launched, your error rate might have dropped because you hired more experienced staff, or market conditions simply shifted in your favor. If you present your ROI calculation without addressing those alternative explanations, any informed stakeholder will push back immediately. Isolating training’s contribution is what separates a defensible training ROI formula from a number that looks good on a slide but falls apart under questioning.
Why isolation matters for your credibility
When leadership asks "how do you know training caused this improvement?", you need a specific answer. Failing to isolate training’s impact is the most common reason ROI analyses get dismissed by finance teams. They expect cause-and-effect thinking in any business case, and training measurement is no different. Your credibility depends on showing that you considered and controlled for other variables before claiming credit for a business result.
If you cannot separate training’s contribution from other factors, your ROI number is a correlation, not a causal claim.
Methods to separate training’s contribution
You have several practical approaches available. The right one depends on your resources, your organization’s size, and how rigorous your stakeholders expect your measurement to be.

Control groups are the most rigorous option. Train one group and hold a comparable group back temporarily. Compare both groups’ performance over the same period. The difference in outcomes is attributable to training rather than to external factors that affected both groups equally.
Trend analysis works well when a control group is not feasible. Pull 12 to 24 months of pre-training performance data to establish your baseline trajectory. If performance was already improving at 1% per month before training and jumped to 4% per month after, you can reasonably attribute roughly 3 percentage points to the program itself.
Manager estimates offer a simpler fallback when data is limited. Ask direct managers to estimate what percentage of the observed improvement they believe training caused, separate from other business changes. Collect estimates from multiple managers and average them. This approach is less precise, but it is transparent and easy to document, which keeps your final calculation honest and defensible when a skeptical stakeholder asks how you arrived at your figures.
Step 5. Calculate ROI, BCR, and payback period
You now have two numbers from the previous steps: your total training cost from Step 2 and your total dollar benefit from Step 3, adjusted for isolation in Step 4. This step is where you run those figures through the training ROI formula and its companion metrics to produce the final output you will bring to leadership. Take your time here, because a small error in how you structure the calculation will produce a percentage that does not match what finance expects to see.
Apply the core ROI formula
Start with net benefits by subtracting your total training cost from your adjusted total benefit. Then divide that result by the total training cost and multiply by 100. Here is a worked example using concrete numbers:
- Total adjusted benefit: $90,000
- Total training cost: $30,000
- Net benefit: $90,000 – $30,000 = $60,000
- ROI: ($60,000 / $30,000) × 100 = 200%
A 200% ROI means the program returned $2 in net value for every $1 spent, on top of recovering the original investment. Write that sentence explicitly in your report, because many stakeholders read an ROI percentage without understanding what it means in plain dollar terms.
Stating the dollar interpretation alongside the percentage removes ambiguity and makes your result far easier for non-finance stakeholders to act on.
Calculate BCR and payback period
Once you have your ROI percentage, add the benefit-cost ratio and payback period to complete the picture. These two metrics answer follow-up questions that leadership almost always asks.
Use this template to record all three metrics in one place:
| Metric | Formula | Your Figures | Result |
|---|---|---|---|
| ROI (%) | (Net Benefit / Total Cost) × 100 | ($60,000 / $30,000) × 100 | 200% |
| BCR | Total Benefit / Total Cost | $90,000 / $30,000 | 3.0 |
| Payback Period | Total Cost / Monthly Net Benefit | $30,000 / $5,000 per month | 6 months |
Fill in your own figures in the third column and let the formulas do the work. For payback period, divide your total net benefit by the number of months in your measurement window to get a monthly net benefit figure first. Running all three calculations together gives you a complete, multi-angle view of program value that holds up to scrutiny from finance, operations, and the executive team simultaneously.
Step 6. Present ROI results leaders will trust
A strong training ROI formula calculation means nothing if you present it poorly. Leadership does not want to wade through a 20-slide deck of learning metrics before getting to a number. They want to see the business problem, the investment, and the return in that order, supported by data they can verify. How you structure and frame your results determines whether they act on them or file them away.
Structure your report around the business problem
Open with the performance gap that triggered the training, not with learning objectives or completion rates. Frame the entire report as a business story: here was the problem, here is what we did, here is what it cost, and here is what the business gained. This structure mirrors how every other department presents an investment case, which makes your analysis immediately legible to finance and operations leaders who did not build it with you.
Use this one-page summary template as your anchor slide or executive brief:
| Section | What to Include |
|---|---|
| Business Problem | The specific KPI gap that prompted the training |
| Program Overview | Audience size, delivery format, total duration |
| Total Investment | Full cost including direct and indirect expenses |
| Measured Outcomes | KPI results before and after training |
| Isolation Method | How you separated training’s contribution from other factors |
| ROI Summary | ROI %, BCR, and payback period with plain-language interpretations |
| Confidence Level | Any limitations or assumptions in your data |
Anticipate the questions you will face
Every credible executive will ask at least one of three questions: How do you know training caused this? What would have happened without it? How does this compare to other investments? Prepare a one-paragraph written answer to each of these before your presentation. Showing that you already considered the hard questions builds far more confidence than having a strong ROI number alone.
Acknowledging the limitations of your analysis upfront signals rigor, not weakness.
Document your isolation method clearly, label any figures that relied on estimates rather than hard data, and state the time window your measurement covered. Transparent methodology turns a ROI percentage into a business case your leaders will defend in their own budget conversations, which is exactly the outcome you are working toward.
Wrap up and decide what to do next
You now have every component of the training ROI formula in one place: how to define outcomes and baselines, track full costs, convert performance shifts to dollars, isolate training’s contribution, and present results that hold up to scrutiny. The process is repeatable. Once you run it once for a single program, applying it to the next one takes a fraction of the time.
Start with one high-stakes program rather than trying to measure everything at once. Pick the training initiative tied to your most visible business problem, document your baseline this week, and track costs from day one. Building the habit of measurement early is what separates L&D teams that protect their budgets from those that lose them.
Accurate ROI calculations depend on reliable tracking data, which requires the right platform behind your programs. See how Axis LMS supports your reporting needs with a free admin demo.