You just spent $50,000 on a new training program. Leadership wants to know one thing: was it worth it? That question is exactly why knowing how to calculate training ROI matters. Without a clear number tied to business outcomes, training budgets are the first line item to get cut, no matter how effective the program actually is.
Training ROI gives you a concrete, defensible metric. It translates hours of coursework, assessment scores, and completion rates into dollars gained versus dollars spent. It’s the difference between saying "employees liked the training" and saying "this program returned $3.20 for every $1 invested." One of those statements keeps your budget intact. The other gets a polite nod and a funding reduction.
The challenge is that most training teams either skip the calculation entirely or oversimplify it. They track completions and satisfaction surveys but never connect those metrics to revenue, productivity, or cost savings. At Atrixware, we built Axis LMS with comprehensive reporting and tracking tools specifically so organizations can capture the data points that feed directly into ROI calculations, from learner progress and assessment performance to compliance completion rates and time-to-competency.
This guide breaks down the training ROI formula, walks you through each step of the calculation, and includes real examples you can adapt to your own programs. Whether you’re justifying a new initiative or proving the value of an existing one, you’ll leave with a repeatable process for putting a dollar figure on your training investment.
What training ROI means and when to use it
Training ROI is the percentage return you get from a training investment relative to its total cost. The metric comes directly from the financial world: you measure what you put in, measure what you got out, subtract costs, and express the result as a percentage. When the number is positive, the program returned more than it cost. When it’s negative, you spent more than you gained. The formula looks simple on paper, but getting accurate inputs is where most organizations fall short, which is why a structured approach matters more than the math itself.
Training ROI isn’t about proving that training is good in general. It’s about proving that a specific program, in a specific context, produced a specific financial return.
The training ROI formula
The standard formula for how to calculate training ROI draws on the work of Jack Phillips, who extended Donald Kirkpatrick’s four-level evaluation model with a fifth level focused entirely on financial return. The core calculation compares net program benefits to total program costs and expresses the result as a percentage.
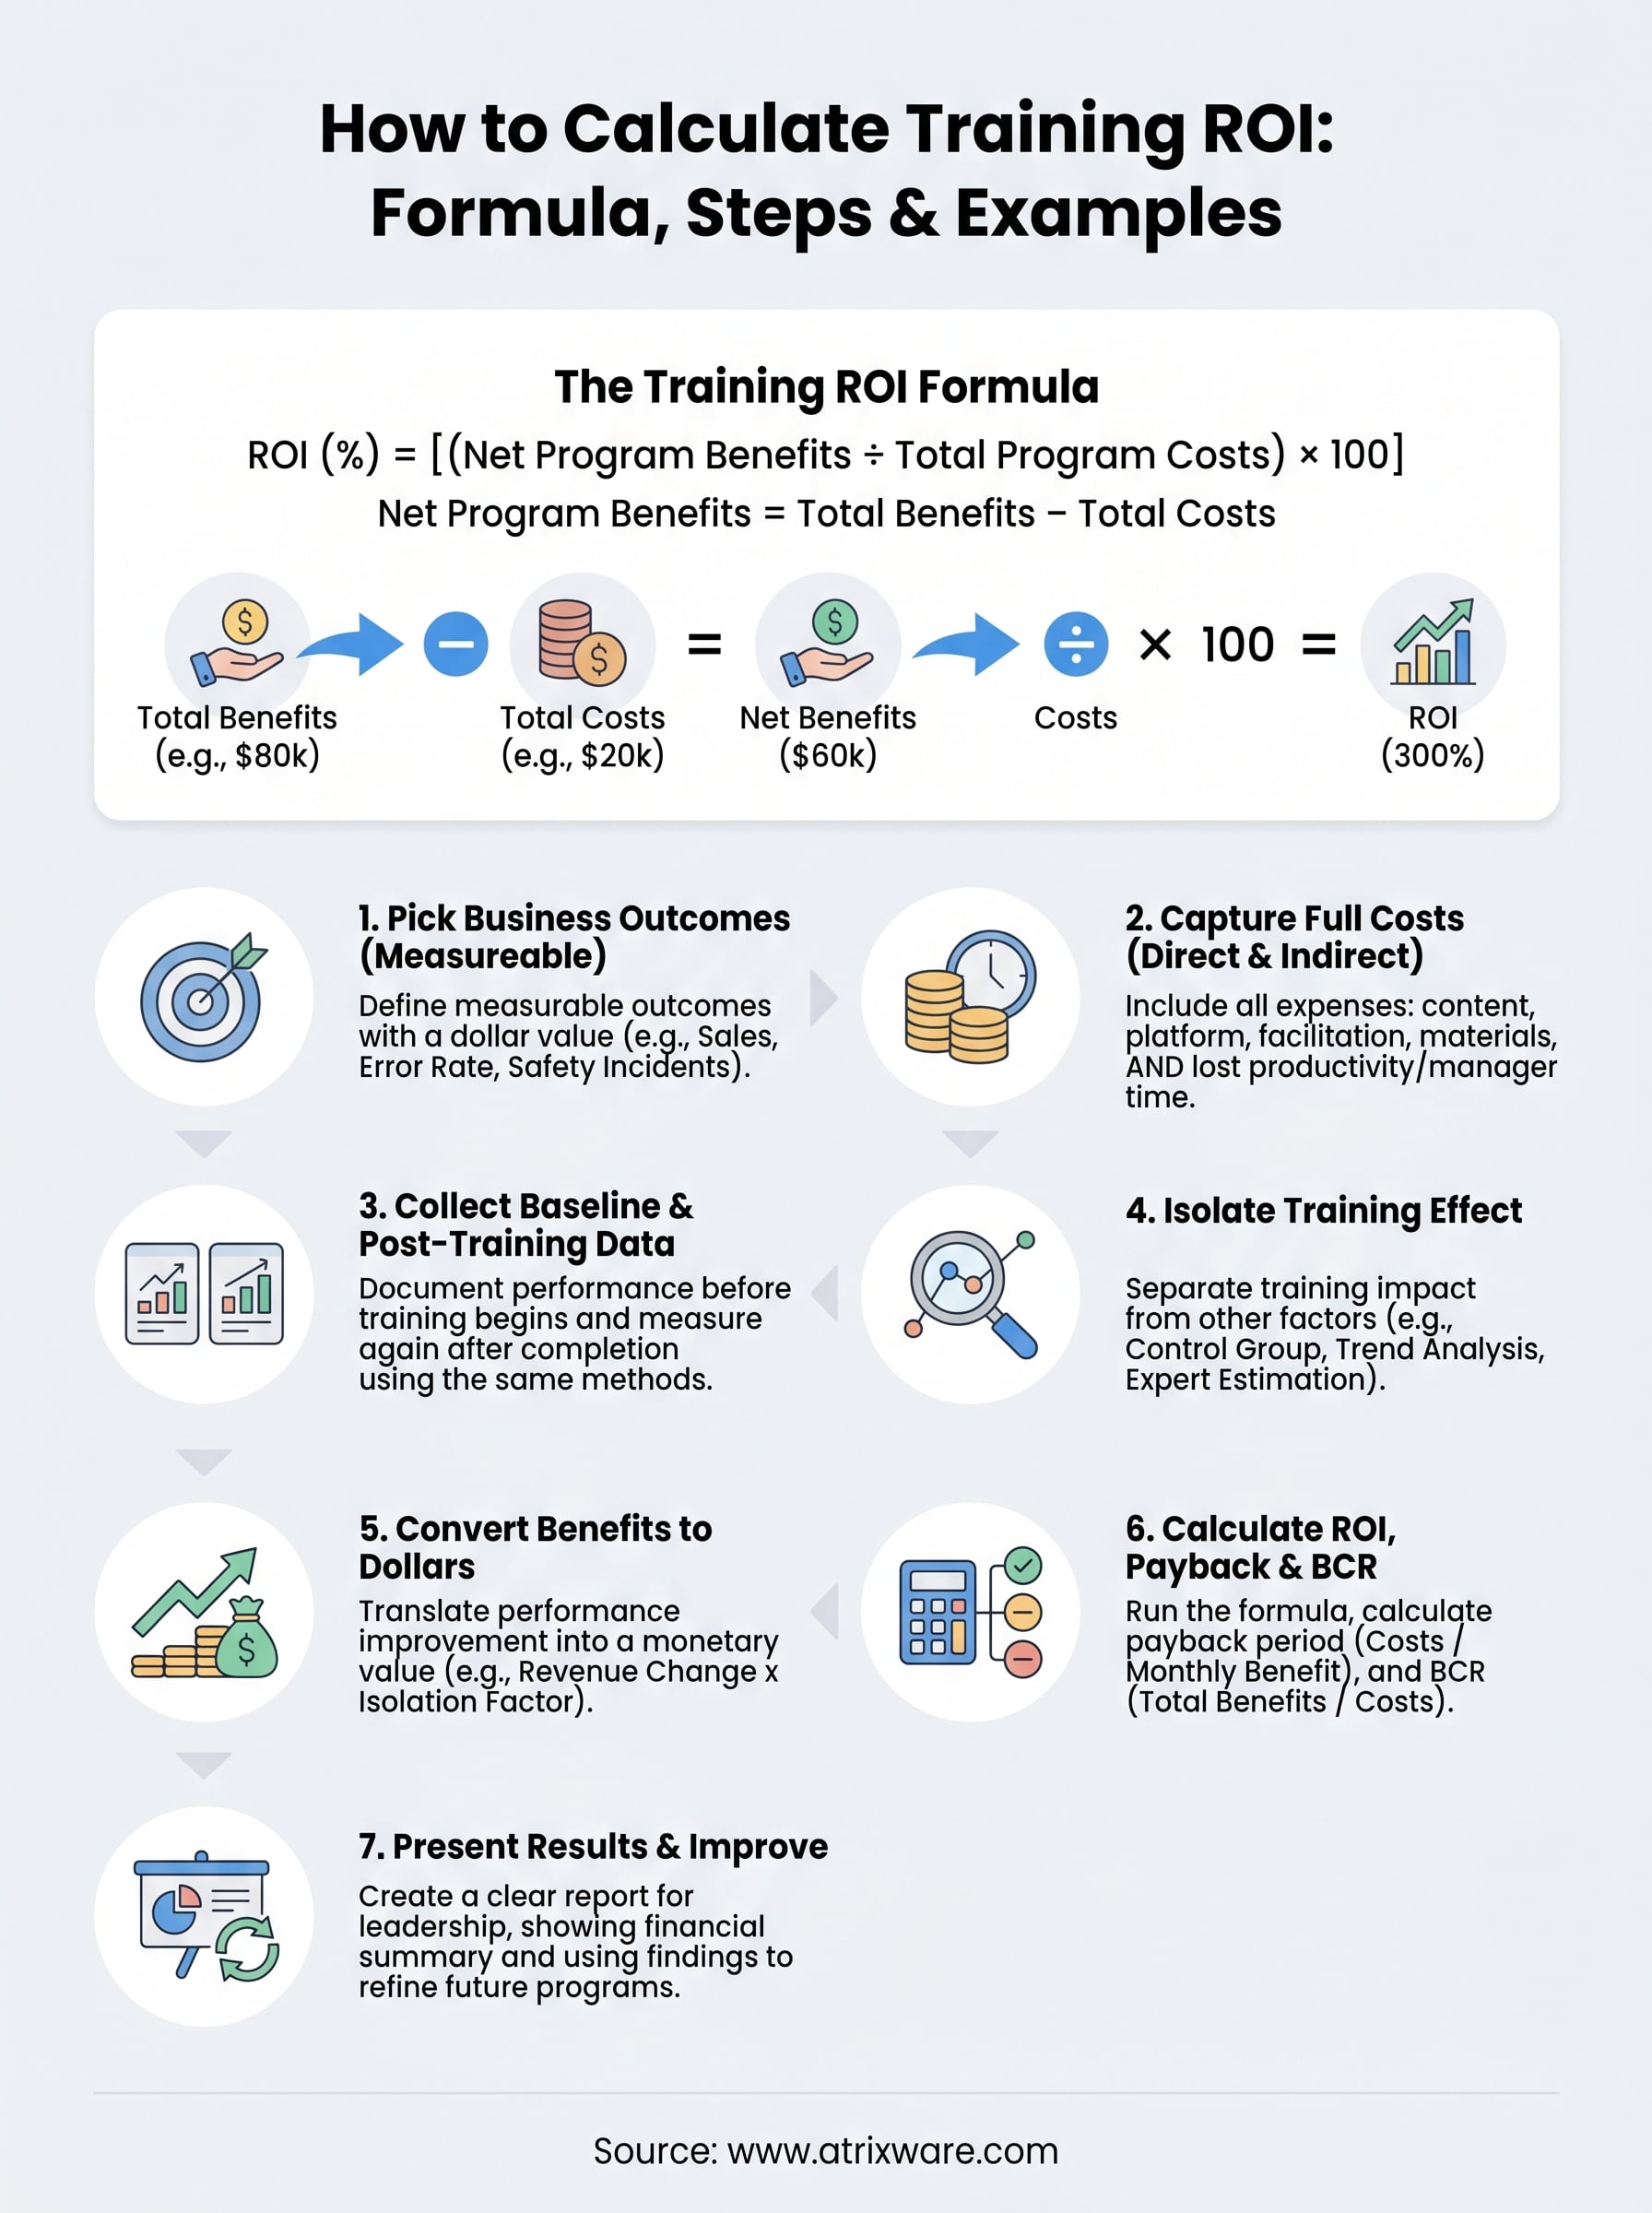
ROI (%) = [(Net Program Benefits ÷ Total Program Costs) × 100]
Where Net Program Benefits = Total Benefits minus Total Costs. In practice, the variables break down like this:
| Variable | What it means | Example |
|---|---|---|
| Total Benefits | Dollar value of outcomes tied to training | $80,000 in productivity gains |
| Total Costs | All direct and indirect costs of the program | $20,000 in design, delivery, and lost work time |
| Net Benefits | Benefits minus costs | $60,000 |
| ROI | (Net Benefits ÷ Costs) × 100 | 300% |
A 300% ROI means you got $3 back for every $1 you spent, after recovering the original investment. Many organizations also calculate the Benefit-Cost Ratio (BCR), which is Total Benefits divided by Total Costs without subtracting costs first. A BCR of 4.0 means $4 in benefits for every $1 spent. Both numbers are useful, and you will calculate both in Step 6 of this guide.
When training ROI is the right metric
Training ROI is the right tool when a program has a clear, measurable business outcome attached to it and the cost of the program justifies the analysis effort. Not every training initiative needs a full ROI calculation. One-time compliance refreshers, brief onboarding checklists, and soft-skills workshops with no trackable output are poor candidates. You would spend more effort calculating ROI than the insight is worth.
The strongest use cases are programs tied to specific performance gaps with a known dollar value. Sales training where you can track revenue changes, safety training where you can measure incident costs, and customer service training where you can monitor handle time and churn rates are all strong candidates for a full ROI analysis.
Consider running a training ROI analysis when any of these conditions apply to your program:
- The training budget exceeds $10,000 and leadership wants financial justification before or after the investment
- The program targets a specific performance problem with a measurable cost to the business
- You plan to scale the program across multiple teams, locations, or customer groups
- Compliance requirements make it essential to document training effectiveness and business impact
- You need to compare two delivery approaches and choose the more cost-effective option
If your program fits one or more of those criteria, the calculation effort pays off. It gives you a number leadership can evaluate on the same terms they apply to any other business investment, not a satisfaction score or a completion percentage.
Step 1. Pick the business outcomes you will measure
The most common mistake when learning how to calculate training ROI is starting with the training itself and working backward to find benefits. Start the other way around. Before you design, buy, or launch a program, define exactly which business outcomes the training is supposed to move. If you cannot name a measurable outcome with a dollar value attached to it, the ROI calculation has no foundation.
The outcome you pick determines everything else: what data you collect, how long you measure, and which costs you attribute to the program.
Choose outcomes tied to performance gaps
Your best candidates are outcomes that already have a known cost to the business when they go wrong. A high error rate in customer orders, long sales cycles, frequent safety incidents, or slow onboarding all represent measurable problems with a price tag. Training aimed at fixing any of those gaps gives you a clear before-and-after comparison to work with.
Avoid picking outcomes that are too broad or too removed from the training content. "Improve employee engagement" or "build a learning culture" are not measurable outcomes for an ROI analysis. Instead, narrow the scope. One concrete outcome per program keeps the calculation clean and defensible, and it reduces the risk of false attribution when results improve.
Here are strong outcome categories with measurable metrics inside each:
| Outcome Category | Measurable Metric | Why It Works |
|---|---|---|
| Sales performance | Close rate, deal size, ramp time | Revenue changes convert directly to dollars |
| Quality and errors | Error rate, rework hours, defect costs | Reductions carry a clear cost-saving value |
| Safety and compliance | Incident rate, fines, audit failures | Each incident carries a documented financial cost |
| Customer service | Churn rate, handle time, CSAT scores | Reduced churn ties directly to revenue retention |
| Employee productivity | Output per hour, time-to-competency | Gains translate to measurable labor cost savings |
Limit yourself to two or three outcomes per program
Tracking too many outcomes at once dilutes your analysis and makes it harder to prove a direct link between the training and any single result. Pick the two or three outcomes most directly connected to the performance gap your training addresses. Once your measurement process is established, you can expand the scope in future program cycles.
Documenting your target outcomes before the program launches also locks in your baseline period. Baseline data collected after training ends introduces bias into the calculation and weakens your ROI case with leadership. Before a single learner starts the course, write down the outcome, the metric, the current performance level, and the target improvement.
Step 2. Capture the full cost of training
Most training ROI calculations come up short because they only count obvious expenses like licensing fees and facilitator pay. Undercounting costs inflates your ROI, which feels good in the short term but creates credibility problems when leadership scrutinizes your methodology. To get an accurate number, you need to account for every resource the organization commits to the program, including the ones that never show up on an invoice.
If you undercount costs, a mediocre program looks strong. If you overcount, a strong program looks weak. Accuracy protects your analysis either way.
Direct costs
Direct costs are the expenses you can tie to a specific line item in your training budget. These are the easiest to capture because they come with receipts, contracts, or vendor invoices. Your direct cost list should include every dollar spent to build, buy, license, and deliver the program.
| Direct Cost Category | Examples |
|---|---|
| Content development | Instructional design fees, authoring tool licenses, video production |
| Platform and technology | LMS subscription fees, hosting, integrations |
| Facilitation | Instructor pay, external trainer fees, travel and accommodation |
| Materials | Printed guides, assessment tools, certificates |
| Administration | Program management time, scheduling, registration support |
Add up every line in that table for your program and you have your direct cost subtotal.
Indirect and hidden costs
Indirect costs are where most organizations undercount, and undercounting is one of the biggest errors in how to calculate training ROI. The largest indirect cost is almost always learner time away from productive work. If 40 employees each spend four hours completing a course, and their average fully loaded labor cost is $45 per hour, that alone adds $7,200 to your total program cost before a single facilitator gets paid.

Other indirect costs to capture include:
- Lost productivity during training hours, calculated as hours multiplied by fully loaded hourly wage
- Manager time spent coordinating enrollment, follow-up, and post-training coaching
- IT and support resources used to configure, test, or troubleshoot the training system
- Performance dip period during the weeks after training when employees practice new skills at reduced speed
Once you have both categories tallied, add them together for your total program cost figure. That number becomes the denominator in your ROI formula and the baseline for your payback period calculation in Step 6.
Step 3. Collect baseline and post-training data
Knowing how to calculate training ROI requires accurate, consistent data from two points in time: before the training runs and after it ends. Without a documented baseline, you are guessing at the improvement. Without post-training data collected at the right interval, you risk measuring noise instead of actual change. This step is where your earlier work in Step 1 pays off. Because you locked in your target outcomes before launch, you already know exactly what to measure and when to start.
Collect your baseline data before a single learner starts the course. Any data gathered after training begins is already contaminated by the intervention.
How to establish a solid baseline
Your baseline is the performance level that existed before the training ran. To build a clean baseline, pull data from your existing systems for the outcome metrics you chose in Step 1. If you are measuring sales close rates, export 90 days of CRM data for the target group. If you are measuring error rates, pull the quality logs from the last quarter. The goal is a specific number, not a rough estimate, so leadership cannot challenge the starting point.
Document the following elements for each metric before training begins:
| Element | What to record |
|---|---|
| Metric name | Close rate, error rate, handle time, incident count |
| Measurement period | Start and end date of the baseline window |
| Data source | CRM, HRIS, LMS reports, quality logs |
| Group size | Number of employees included in the measurement |
| Baseline value | The actual number or percentage |
When and how to collect post-training data
Post-training data collection timing depends on the type of skill being developed. Procedural skills like software use or compliance procedures often show measurable improvement within 30 days. Complex skills like consultative selling or leadership behavior typically require 60 to 90 days before changes stabilize in the data.
Use the same data source, the same date range length, and the same group definition you used for your baseline. Changing any one of those variables undermines the validity of your comparison and gives critics an easy way to dismiss your results. Once you have both numbers recorded, you can calculate the raw performance change and move to the next step, where you confirm how much of that change actually came from the training itself.
Step 4. Isolate the training effect from other factors
Raw performance improvement is not the same as training impact. If your sales team’s close rate climbed 12 points after a training program, you need to prove that the training caused the change, not a new compensation plan, a seasonal market shift, or a competitor exiting the market. This is the step that separates a defensible ROI calculation from an inflated one. Skipping it is the single biggest credibility risk in how to calculate training ROI.
If you cannot credibly separate the training effect from external factors, leadership will do it for you, and their estimate will almost always be less favorable than yours.
Why isolation matters in training ROI
Attribution errors destroy trust in your analysis. If you claim 100% of a performance gain came from training when the sales team also got new pricing authority that quarter, a skeptical CFO will dismiss the entire report. Taking the time to isolate training’s contribution, even imperfectly, shows methodological discipline and makes your results far harder to challenge. The goal is not a perfect number but a reasonable, documented estimate that you can defend.
Methods to isolate training impact
Several practical techniques let you attribute a portion of the performance change specifically to training. Each carries different levels of rigor and data requirements. Choose the method that fits your available resources and the stakes of the analysis.

| Method | How it works | Best used when |
|---|---|---|
| Control group | Compare trained employees against a similar, untrained group over the same period | You can split groups without business disruption |
| Trend line analysis | Project pre-training performance forward and compare to actual results | You have at least 90 days of clean baseline data |
| Expert estimation | Ask managers or subject matter experts to assign a percentage of the change to training | No control group is possible; document the rationale |
| Participant estimation | Survey learners and ask them to estimate what percentage of their improvement came from training, then apply a confidence discount | Large groups where manager input is impractical |
Expert and participant estimation are the most commonly used methods in corporate settings because control groups are operationally difficult. When you use estimation, always apply a confidence discount to the attributed percentage. If participants estimate training drove 60% of the improvement with 80% confidence, your isolation factor is 0.60 × 0.80 = 48%. That discounted figure becomes your multiplier when you calculate benefits in the next step.
Step 5. Convert training benefits into dollars
Once you have an isolated performance improvement from Step 4, you need to translate that change into a dollar figure before you can complete the ROI formula. This is the step where knowing how to calculate training ROI gets tangible. You are taking the performance delta, applying your isolation factor, and expressing the result as a monetary benefit your organization actually captured.
Translate performance changes into monetary value
The conversion method you use depends on what type of outcome you tracked. Some outcomes convert to dollars almost automatically because they live in financial systems. Others require a standard value your organization agrees on in advance. Picking the right method for each outcome keeps your analysis credible and consistent across program evaluations.
Always document your conversion method and data source before you present results. A number without a sourcing explanation invites skepticism from any finance or leadership audience.
Use this table to match your outcome type to the right conversion approach:
| Outcome Type | Conversion Method | Example |
|---|---|---|
| Sales revenue | Actual revenue change × isolation factor | Close rate up 8%, average deal $12,000, 20 reps |
| Error or rework reduction | Hours saved × fully loaded labor rate | 50 fewer error hours/month × $45/hour = $2,250/month |
| Safety incident reduction | Incidents avoided × average incident cost | 3 fewer incidents × $8,000 average cost = $24,000 |
| Employee turnover reduction | Reduced separations × replacement cost | 2 fewer exits × $15,000 replacement cost = $30,000 |
| Productivity gain | Additional output units × value per unit | 5% faster processing × $30/hour labor rate |
A worked example
Suppose your sales training program produced a 4-point improvement in close rate for a team of 25 reps, each averaging 10 deals per month at $8,000 per deal. Your raw monthly benefit is 25 reps × 10 deals × 0.04 improvement × $8,000 = $80,000 per month. Over a six-month measurement window, that is $480,000 in gross benefit.
Now apply your isolation factor from Step 4. If your estimate attributed 55% of the improvement to training with a confidence discount applied, multiply $480,000 by 0.55. Your attributed benefit is $264,000. That figure is what you carry into Step 6 as your Total Benefits value, not the inflated gross number.
Step 6. Calculate ROI, payback period, and BCR
You now have two clean numbers: your total attributed benefits from Step 5 and your total program costs from Step 2. This is the step where the full picture of how to calculate training ROI comes together. Run three calculations, not one. ROI, payback period, and Benefit-Cost Ratio each tell a different part of the financial story, and presenting all three gives leadership the complete picture they need to make informed decisions about your program.
Run the ROI formula
Plug your numbers directly into the core formula and express the result as a percentage. Net Program Benefits equals Total Benefits minus Total Costs. Then divide Net Benefits by Total Costs and multiply by 100.
Using the sales training example from Step 5, the math looks like this:
| Variable | Value |
|---|---|
| Total Attributed Benefits | $264,000 |
| Total Program Costs | $48,000 |
| Net Benefits | $216,000 |
| ROI | ($216,000 ÷ $48,000) × 100 = 450% |
A 450% ROI means the program returned $4.50 for every $1 spent, after recovering the original investment. Write that number down in plain language alongside the formula. Leadership responds to the plain-language version far faster than the percentage alone.
The ROI percentage is your headline number, but it only holds up if your cost and benefit inputs are accurate and documented.
Calculate the payback period
Payback period tells you how quickly the program recovers its costs, which matters when budgets are tight and leadership wants to know when they break even. Divide your total program costs by the monthly benefit figure before the measurement window closes.
If your program cost $48,000 and the attributed monthly benefit runs at $44,000 ($264,000 divided by 6 months), your payback period is $48,000 ÷ $44,000 = roughly 1.1 months. Shorter payback periods strengthen your case for future investment.
Calculate the Benefit-Cost Ratio
BCR gives you a simpler ratio that finance teams often prefer because it does not require the net benefit subtraction step. Divide Total Benefits by Total Costs without any adjustment.
Using the same example: $264,000 ÷ $48,000 = a BCR of 5.5. That means $5.50 returned for every $1 invested. Pair the BCR alongside your ROI percentage and payback period in every report you submit, so stakeholders can evaluate your program using whichever metric they find most intuitive.
Step 7. Present results and improve the program
Running the numbers is only half the job. Presenting your findings in a format leadership can act on and using those findings to sharpen future programs is what turns a one-time calculation into an ongoing competitive advantage. This final step in how to calculate training ROI closes the loop between measurement and improvement, which is the only reason the analysis is worth doing in the first place.
A number sitting in a spreadsheet changes nothing. A number connected to a clear recommendation changes budgets.
Structure your results report
Every results report should answer three questions in order: what did the program cost, what did it return, and what should we do next. Keep the report short. A single-page summary with supporting data in an appendix is far more likely to get read and acted on than a 20-slide deck. Use this template as your starting structure:
| Section | What to include |
|---|---|
| Program overview | Name, scope, number of learners, delivery dates |
| Outcomes targeted | The metrics you chose in Step 1 and the baseline values |
| Total costs | Direct and indirect cost breakdown from Step 2 |
| Performance results | Baseline vs. post-training data with measurement dates |
| Isolation method | Which method you used and the attribution percentage applied |
| Financial summary | Total benefits, net benefits, ROI %, BCR, payback period |
| Recommendations | One to three specific actions based on the results |
Lead with the financial summary and your headline ROI number in the first paragraph, then walk leadership through the methodology. Audiences trust conclusions that come with a clear paper trail, so show your inputs and conversion methods, not just the final percentage.
Use findings to improve future programs
Your ROI results reveal exactly where the program created value and where it did not. If error reduction produced strong returns but sales performance showed minimal improvement, that tells you where to concentrate redesign effort in the next cycle. Treat each analysis as a feedback loop, not a report card.
Document what worked and what fell short before you archive the data. Note which outcome metrics were cleanest, which cost categories were hardest to capture, and whether your isolation method held up to scrutiny. That documentation cuts your setup time in half when you run the next evaluation, and it builds the institutional knowledge your team needs to make every future training investment more defensible.
Wrap up and what to do next
You now have a complete, repeatable process for how to calculate training ROI from picking the right outcomes all the way through presenting results to leadership. The formula itself is straightforward: subtract total costs from total benefits, divide by costs, and multiply by 100. What makes or breaks the analysis is the quality of your inputs, which is why each step in this guide focuses on data collection, isolation, and honest attribution rather than just the arithmetic.
Start small. Pick one upcoming program with a clear performance gap, document your baseline before training begins, and run through all seven steps. One clean analysis builds more credibility with leadership than a dozen anecdotal reports. The right LMS makes that process faster by giving you the tracking, reporting, and completion data you need without manual effort. Take the Axis LMS readiness quiz to see how your current setup stacks up.