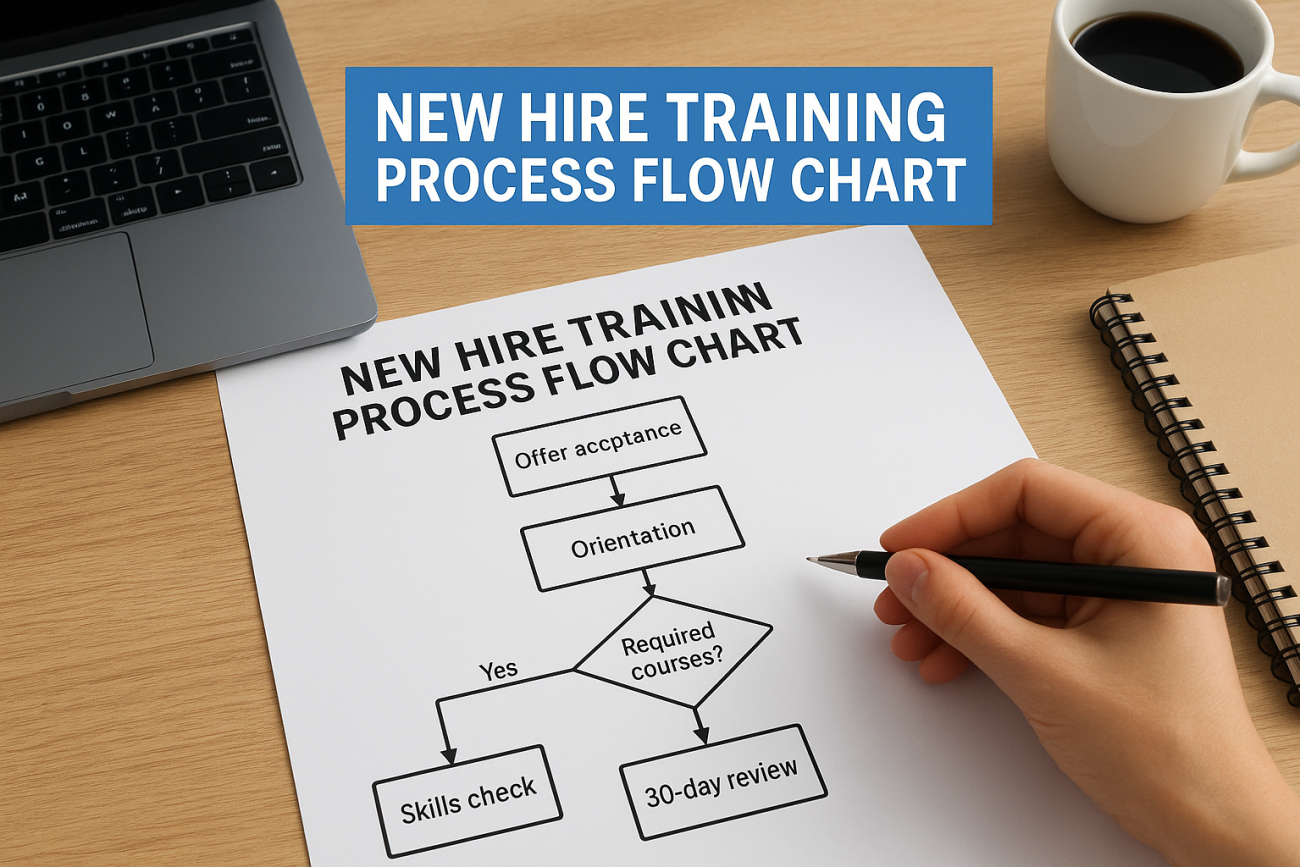
To build a new hire training process flow chart, list every stage from offer acceptance to day 90. Give each task one owner. Add a yes/no checkpoint wherever a new hire must finish or pass something before moving on. Then draw it with standard flowchart shapes. A copy-ready starter chart is included below, so you can edit it instead of starting from a blank page.
Most new hire training lives in a manager’s head or in a scattered checklist. IT forgets the laptop, the compliance course lands in week six, and nobody knows whether the new hire finished it. More training does not fix this. A visible sequence with clear owners and clear checkpoints does.
This guide covers four steps: mapping stages and owners, adding decision points, drawing and testing the chart, and running it day to day. We build Axis LMS, so we also show how the chart turns into assignments and reports once you deliver the training online.
Why map new hire training as a flow chart
A flow chart shows sequence, ownership and decisions on one page, which a checklist cannot do. Everyone can see what happens next, who does it and what happens when something goes wrong.
What the chart adds and where it stops
A checklist tells you what to do. A flow chart also shows who does it and what must be true before the next step starts. That matters most at handoffs, such as IT finishing accounts before the first training session, or a manager signing off a skills check before the new hire works unsupervised.
Keep the scope clear. The wider onboarding process in HR covers paperwork, payroll, benefits and culture. The training flow is the part that teaches the new hire to do the job correctly and safely. Your chart can hold both, but the training steps should be easy to spot. A useful frame is the four Cs: compliance, clarification of the role, culture and connection with colleagues.
A flow chart turns "who does what, and when" into something a new hire and a manager can both see.
What to gather before you draw
Collect these inputs first, so you draw from facts instead of memory:
- Your current checklists, welcome emails and slide decks
- The list of required courses, such as safety, privacy and anti-harassment
- The tools and systems the role needs access to
- Notes from your last two or three hires on what was missing or late
- The name of one person who owns the whole process
Step 1. Map the stages and owners
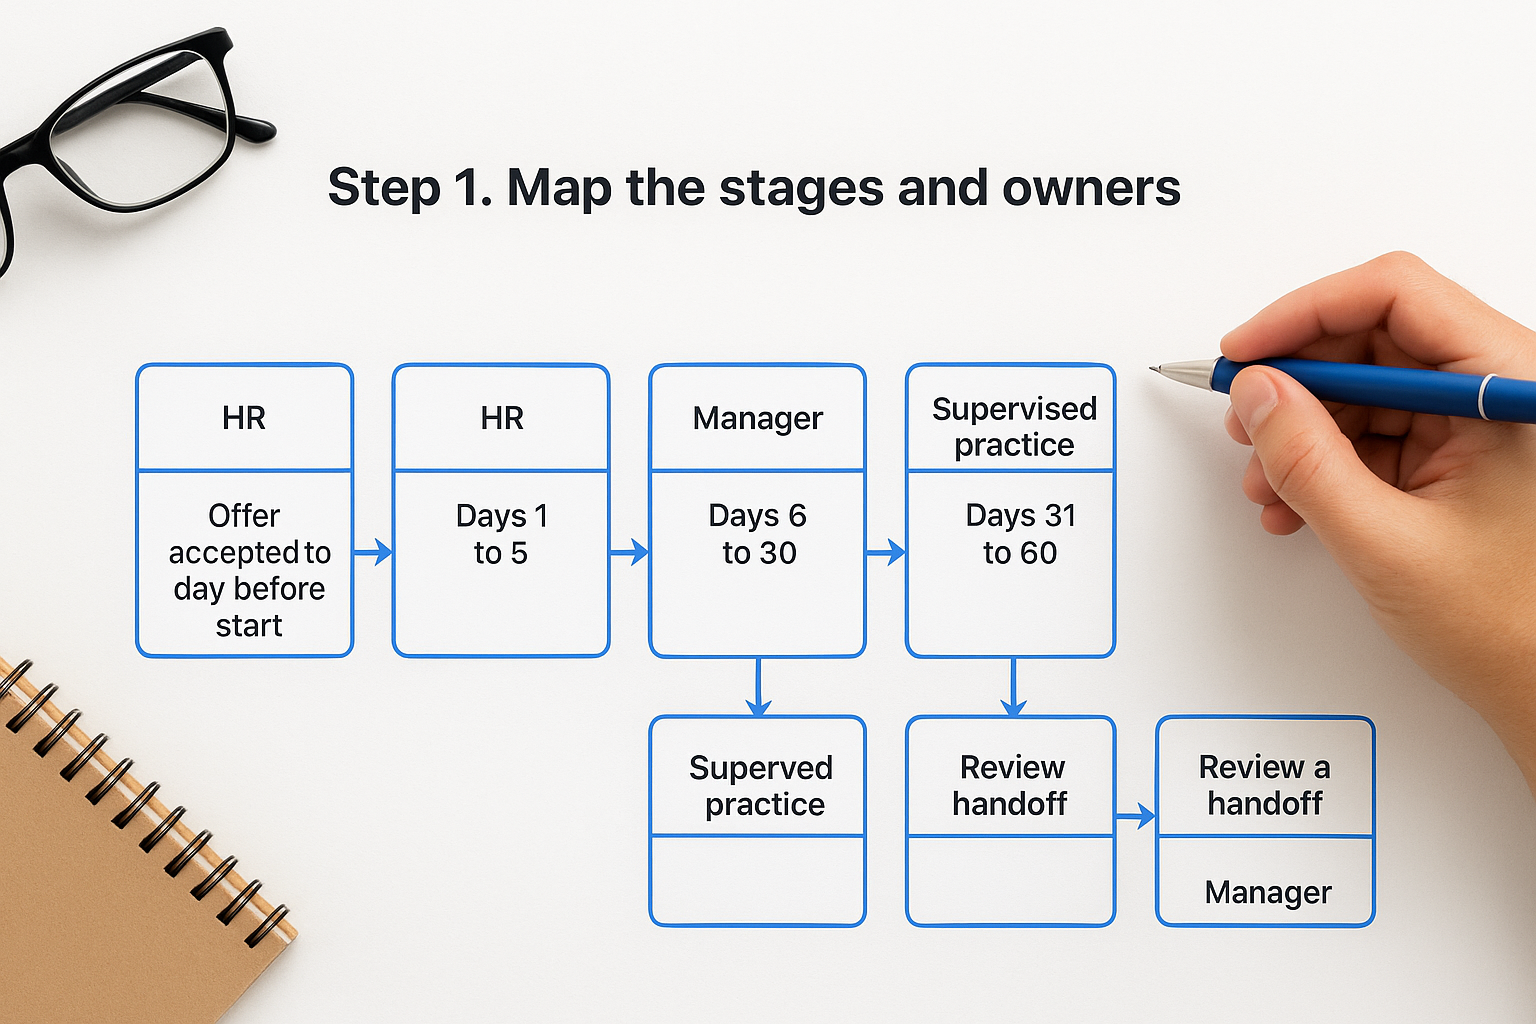
Divide the first 90 days into five stages, and give each a timing, an owner and a verifiable output. This gives you the main line of the chart before any branching.
Break the first 90 days into stages
The table below is a workable default for a role of moderate complexity. Stretch the timing for technical or regulated roles and shorten it for simple ones.
| Stage | Timing | Owner | Output |
|---|---|---|---|
| Pre-boarding | Offer accepted to day before start | HR and IT | Paperwork signed, accounts and equipment ready |
| Orientation | Days 1 to 5 | HR and manager | Policy, safety and compliance courses done |
| Role training | Days 6 to 30 | Manager and trainer | Job tools learned, skills check passed |
| Supervised practice | Days 31 to 60 | Manager and buddy | Real tasks completed with review |
| Review and handoff | Days 61 to 90 | Manager and HR | Review held, development plan set |
Every output should be something you can check without guessing. "Learn the order system" cannot be verified. "Enter five sample orders with no errors" can. Write outputs like the second one, because they become your checkpoints in the next step.
Assign one owner per task
Every box on the chart needs exactly one owner, whether a person or a role. Shared ownership usually means nobody sends the reminder. Typical owners are HR, IT, the hiring manager, a buddy and the new hire.
If your tool supports swimlanes, give each owner a horizontal lane. Handoffs then show up as arrows that cross lanes, and a missing handoff is easy to see.
A task with two owners has none, so give every box one name or one role.
Step 2. Add decision points and triggers
Place a decision point, drawn as a diamond with a yes/no question, wherever a new hire must finish or pass something before the next stage begins. This is what separates a real new hire training process flow chart from a list with arrows.
Place checkpoints where mistakes cost most
Most roles need three checkpoints, and you can add more for regulated work:
- Required courses done? Check this by day 5, before the new hire touches customer data or equipment.
- Skills check passed? Check this at the end of role training, with a manager or trainer scoring it against the outputs from Step 1.
- On track at 30 days? Hold a short review that covers workload, confidence and open questions.
Phrase each question so it has one honest answer. "Is the new hire doing well?" is vague. "Did the new hire score at least 80% on the order-entry check?" is not.
Define what happens on a No
A diamond with only a Yes arrow is a wish, not a process. Every No needs a specific action and a loop back to the same question. If the privacy course is not done by day 5, the manager gets a reminder and sits down with the new hire to find the blocker. If the skills check fails, the new hire gets coaching and a retake date.
Triggers work the same way. The start date, a completed course and a passed check should each set the next task in motion. Write the trigger on the arrow so nobody has to remember it.
Every No branch needs an action and a loop back, or the chart stops where real problems start.
Step 3. Draw the chart and test it
Draw the chart top to bottom with four standard shapes, then walk your most recent hire through it before you publish. Any diagramming tool works, and a plain slide works too.
Use a few standard shapes
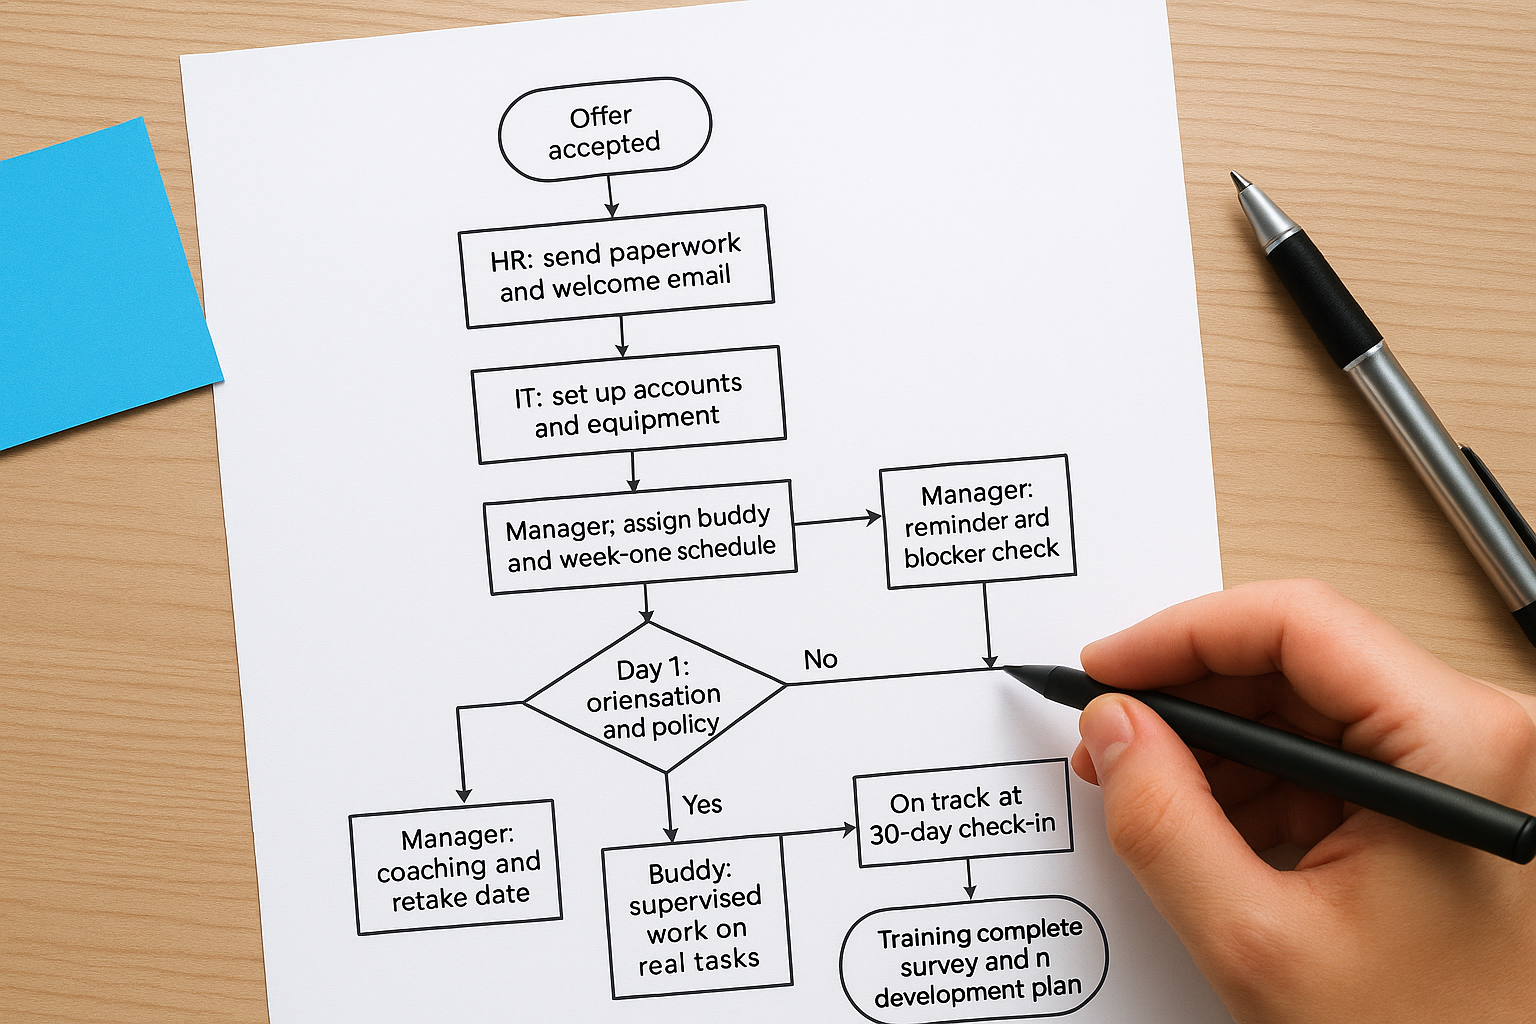
Stick to this shape set so anyone can read the chart without a legend:
- Oval: start and end points
- Rectangle: a task with one owner
- Diamond: a yes/no decision
- Arrow: the next step, labeled when it is a trigger or a Yes/No answer
Begin every task label with the owner and a verb, such as "IT: set up accounts." Many diagram tools, including draw.io, can render Mermaid text. You can then export the result as an image or PDF.
Start from this template
Paste this into a Mermaid-compatible tool and edit the labels to match your company:
flowchart TD
    A([Offer accepted]) --> B[HR: send paperwork and welcome email]
    B --> C[IT: set up accounts and equipment]
    C --> D[Manager: assign buddy and week-one schedule]
    D --> E([Day 1: orientation and policy training])
    E --> F{Required courses complete by day 5?}
    F -- No --> G[Manager: reminder and blocker check] --> F
    F -- Yes --> H[Trainer: role training on tools and processes]
    H --> I{Skills check passed?}
    I -- No --> J[Manager: coaching and retake date] --> I
    I -- Yes --> K[Buddy: supervised work on real tasks]
    K --> L{On track at 30-day check-in?}
    L -- No --> M[Manager and HR: adjust plan] --> K
    L -- Yes --> N[Manager: 60 and 90 day reviews]
    N --> O([Training complete: survey and development plan])
Test it against a real hire
Take your latest hire and trace their first 90 days through the chart. Every box you cannot match to something that happened is either unnecessary or a step you skipped. Every real event with no box is a gap. Fix both before anyone else sees the chart.
If your last hire cannot be traced through the chart, the chart is not finished.
Step 4. Run the chart and measure it
A chart only works if it drives daily assignments, so publish it where new hires and managers will see it, connect each training box to a real assignment, and review the results every quarter.
Turn boxes into assignments
Each training rectangle should become a dated assignment, such as a course with a due date. Doing this by hand across email and spreadsheets is where the process breaks down. In Axis LMS, user data can sync from HR systems such as ADP and BambooHR. The platform also includes automation workflows and automated communication tools. Enrollments and reminders can then follow the chart instead of someone’s memory.
Smaller teams can start with Axis LMS Lite, which is built for organizations of 25 to 100 employees and includes automation workflows. Either way, put the finished chart where the new hire sees it on day one.
Measure and revise
Track four numbers: course completion rate by stage, days from start to the first passed skills check, the share of new hires on track at day 30, and the new hire’s own rating at day 90. If 8 of 10 new hires pass the skills check on the first try, the Yes path works. If only 4 do, the training before that diamond needs work.
Review the chart each quarter. Also review it whenever a role, tool or policy changes, so the chart never describes last year’s process.
Measure the checkpoints, because they show you which stage of training is failing.
Put your chart to work
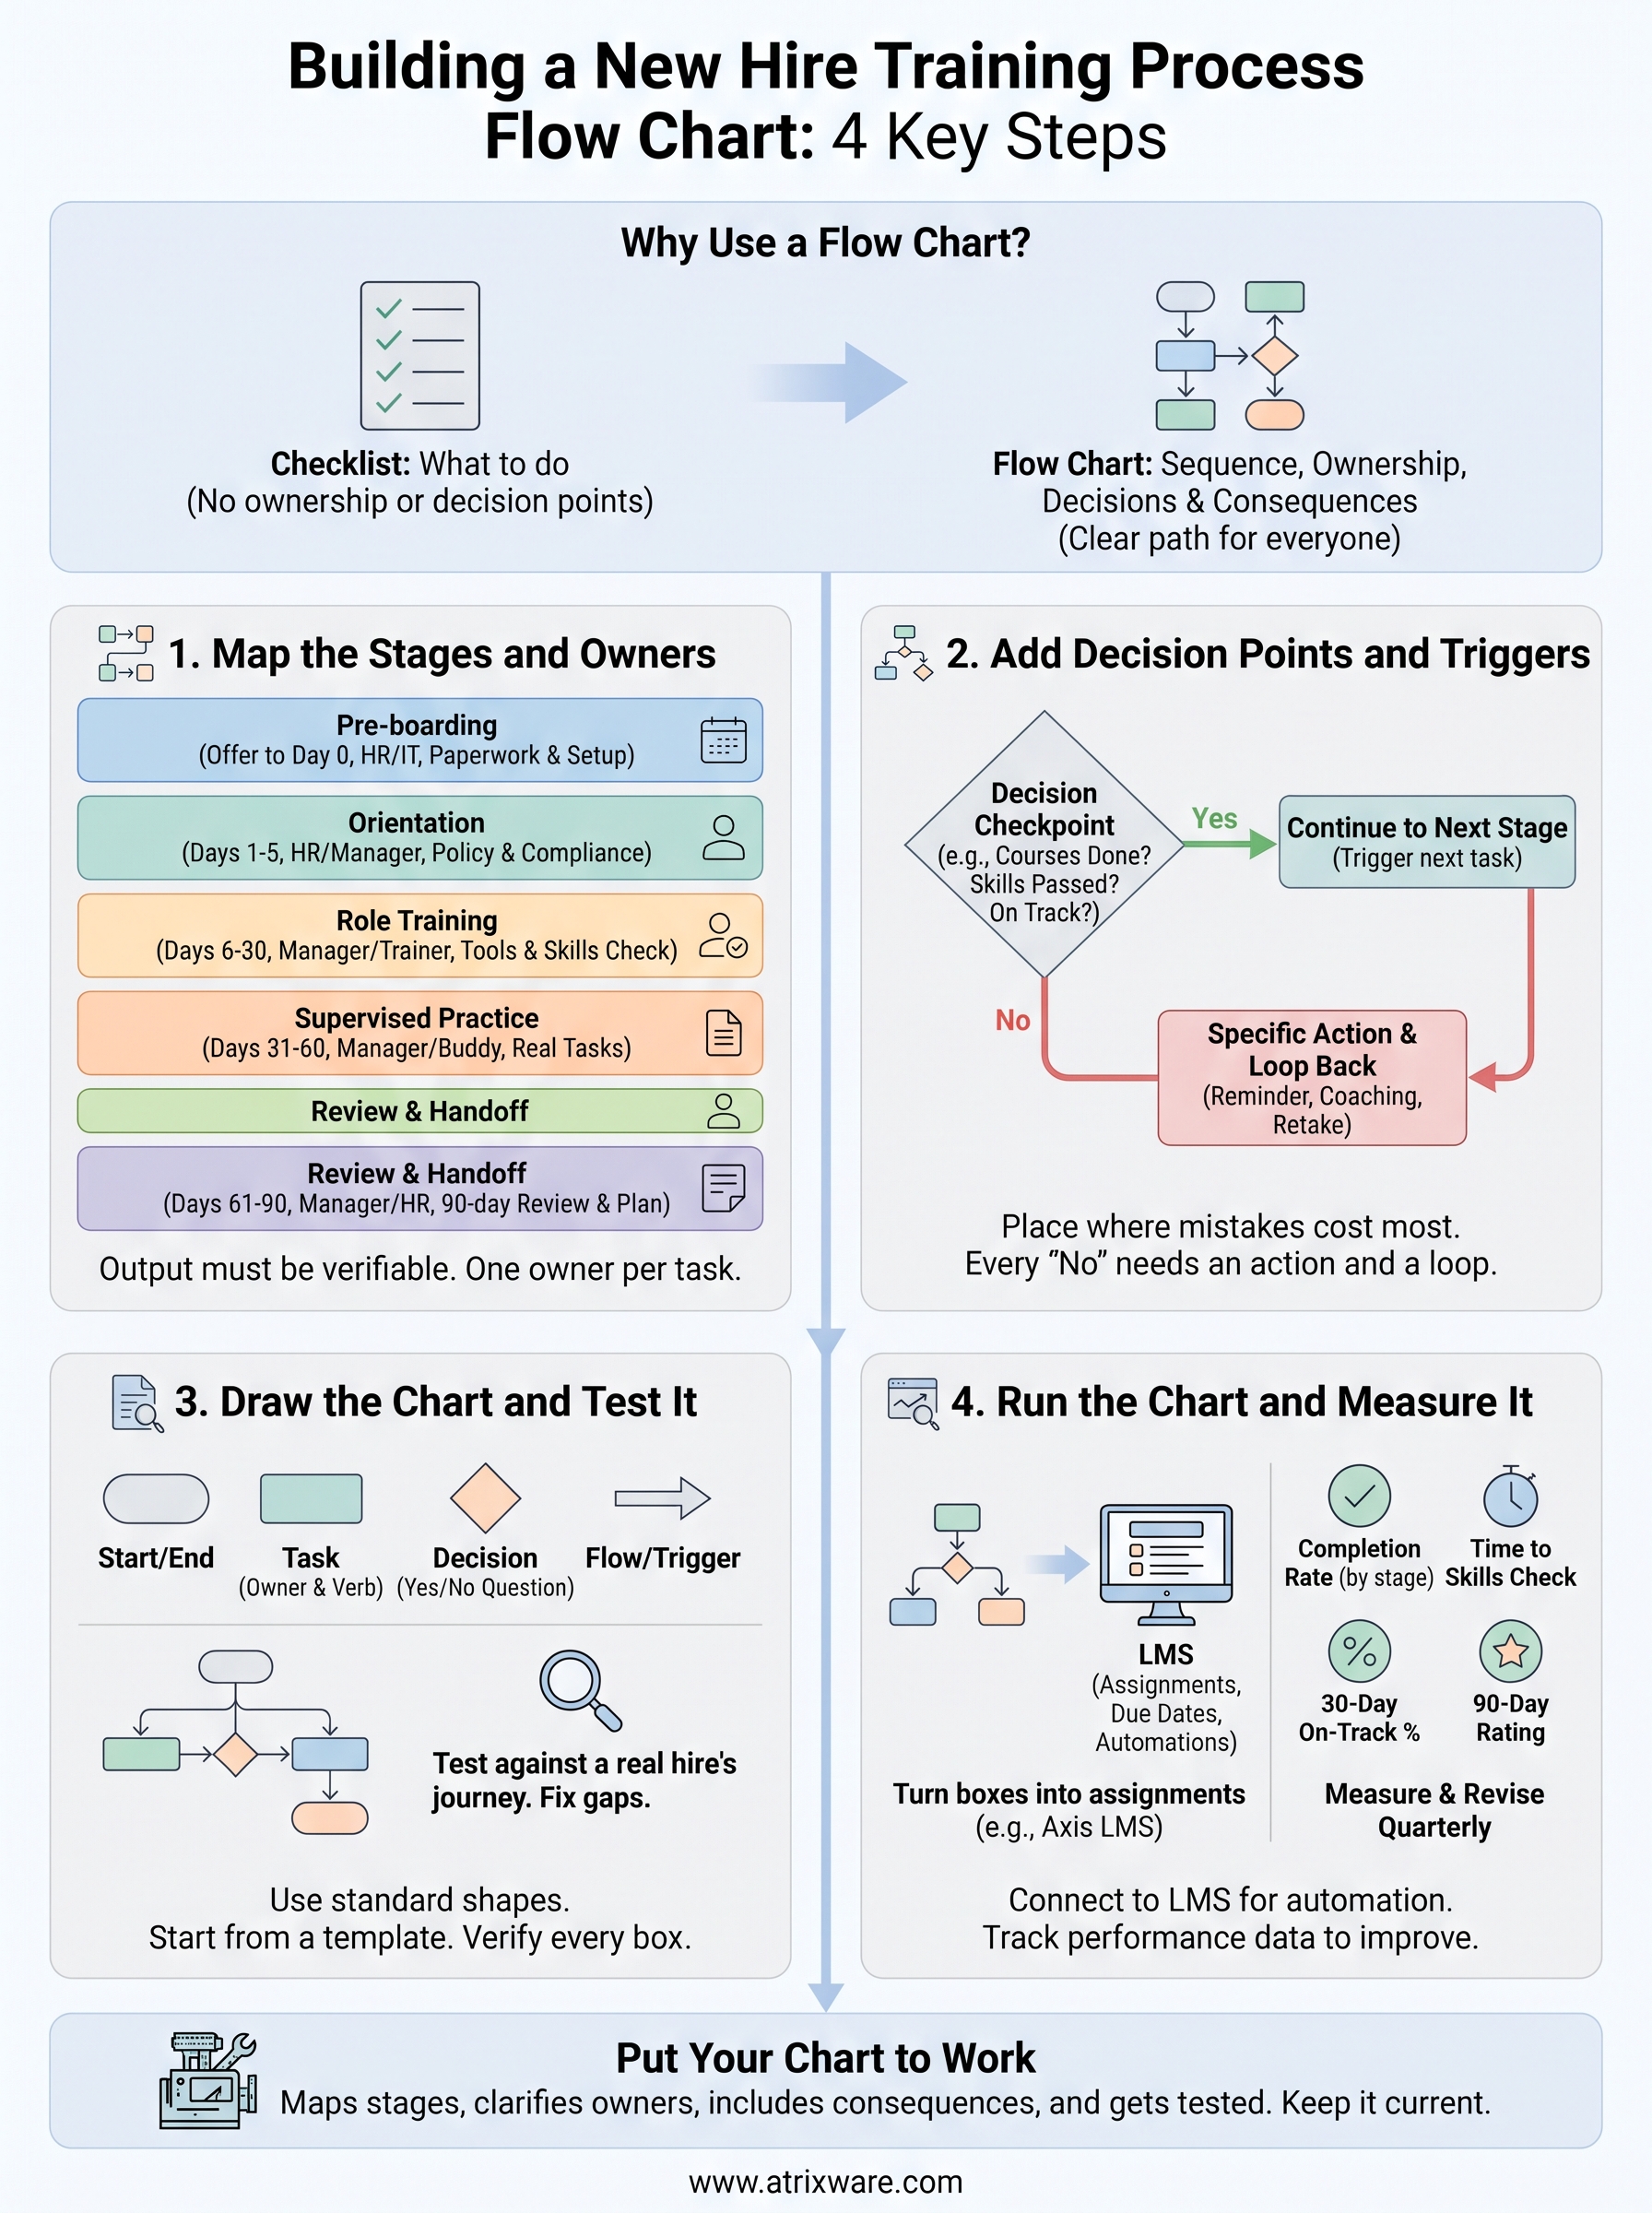
A good new hire training process flow chart maps the stages, gives each task one owner, adds checkpoints with real consequences, and gets tested against a real hire. Start with the template, adjust it to your roles, and keep it current.
Once the chart is ready, the next question is how you will deliver and track the training behind each box. If you are weighing an LMS for that job, take the LMS readiness quiz to see where you stand in the buying process.
