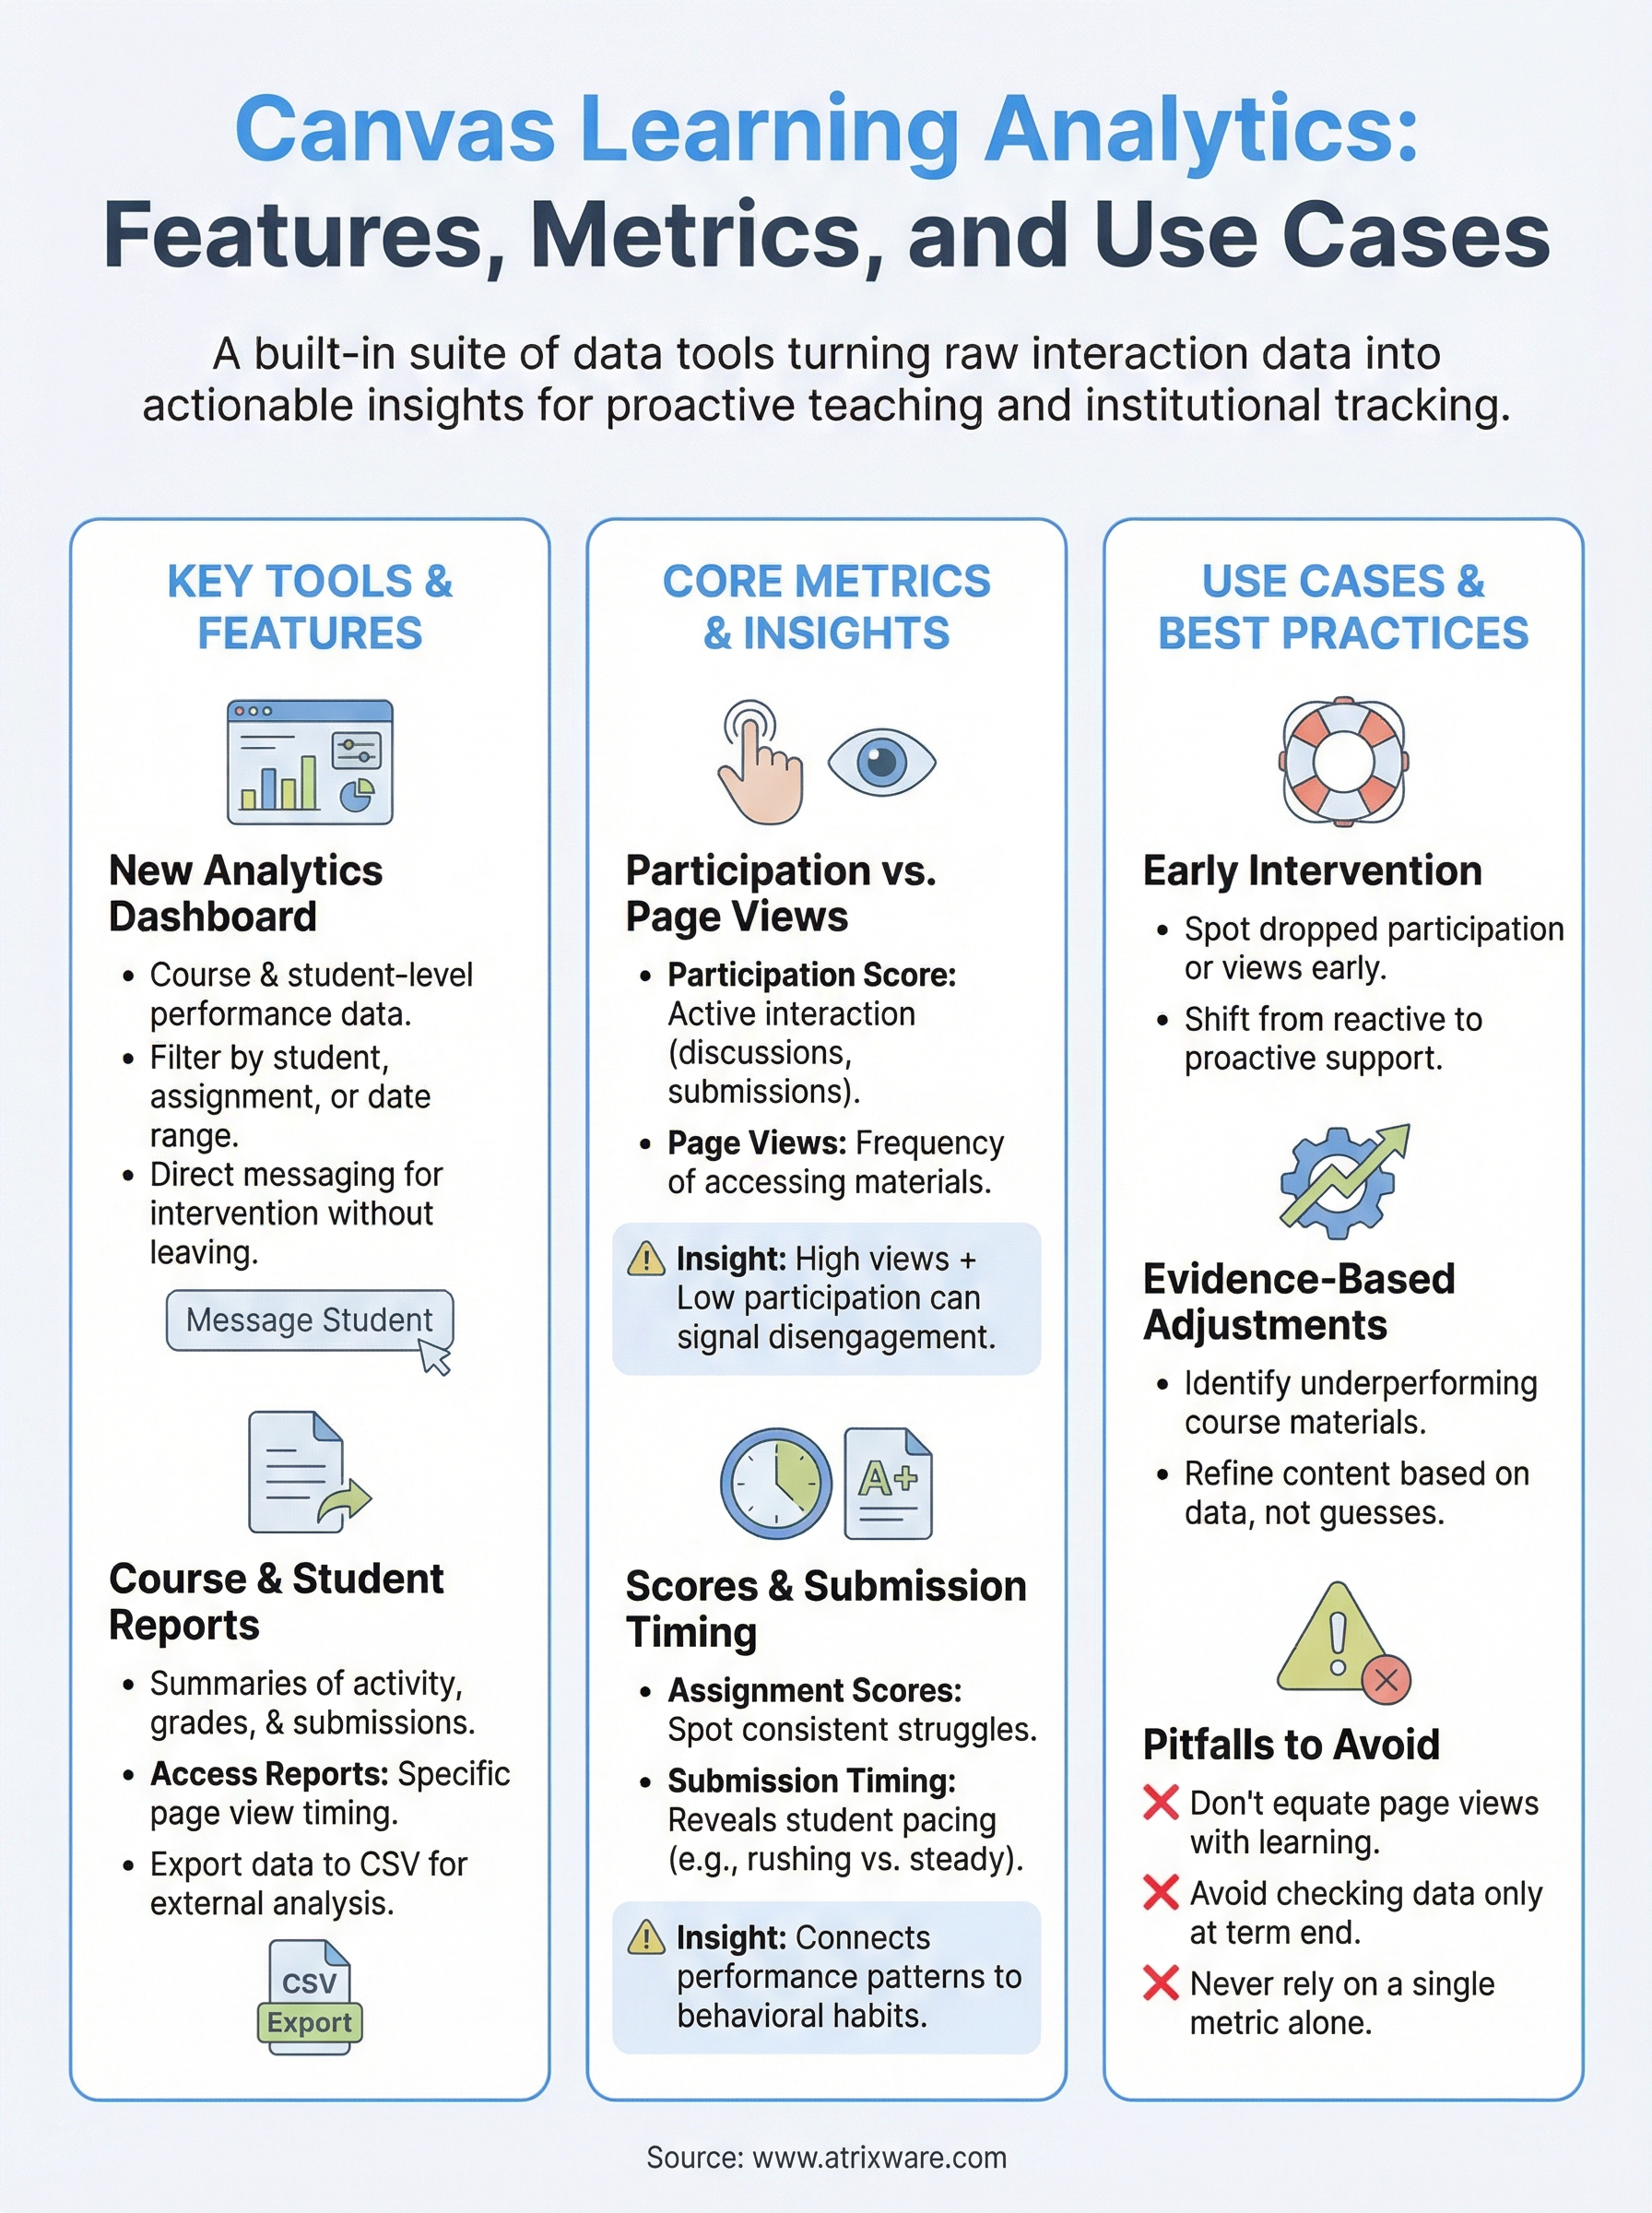
Canvas LMS gives instructors and administrators access to a built-in suite of data tools, commonly referred to as canvas learning analytics, that track student performance, engagement, and course activity. These tools turn raw interaction data into actionable insights, helping educators identify struggling students early, measure the effectiveness of course materials, and make informed adjustments before small problems become big ones.
But what exactly can you monitor, and how do the different metrics and reports actually work in practice? That’s what this article breaks down. We’ll walk through the core features, the key data points available, and real use cases that show how institutions put these analytics to work.
At Atrixware, we build Axis LMS with robust reporting and analytics at its core, so we understand what matters when it comes to tracking learning outcomes. Whether you’re evaluating Canvas or comparing LMS platforms, this guide gives you a clear picture of what Canvas offers on the analytics front and where those capabilities fit into broader training goals.
What Canvas learning analytics includes
Understanding what canvas learning analytics actually covers helps you get the most out of the platform. Canvas combines real-time dashboards, historical reports, and student-level data into a layered system that spans both course-level monitoring and broader institutional tracking. Knowing which tool handles which job keeps you from missing data that’s already available to you.
New Analytics
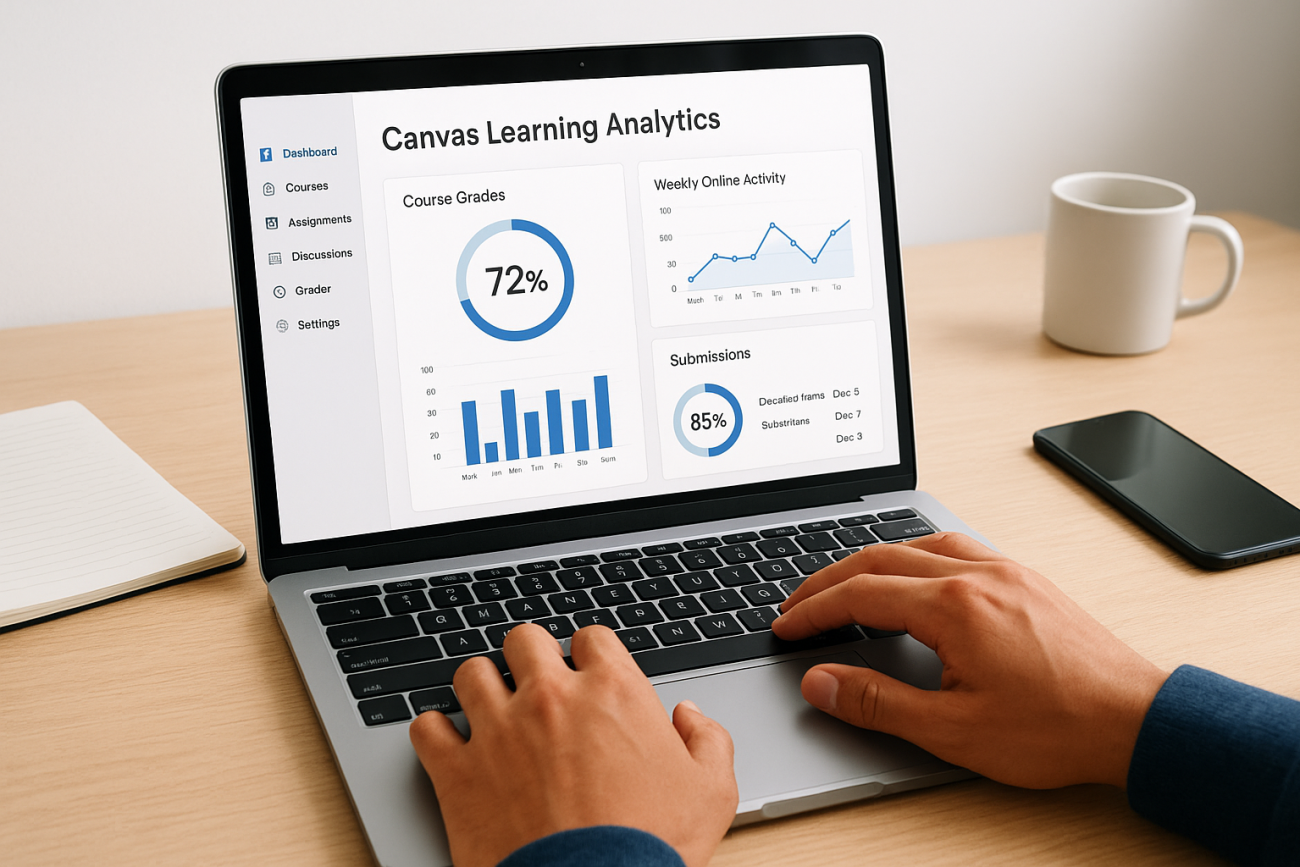
New Analytics is Canvas’s primary data dashboard, giving you access to course-level metrics and individual student performance data in one place. From here, you can filter by assignment, student, or date range to see trends across your course. It surfaces average scores, participation rates, and how individual learners track against the class average.
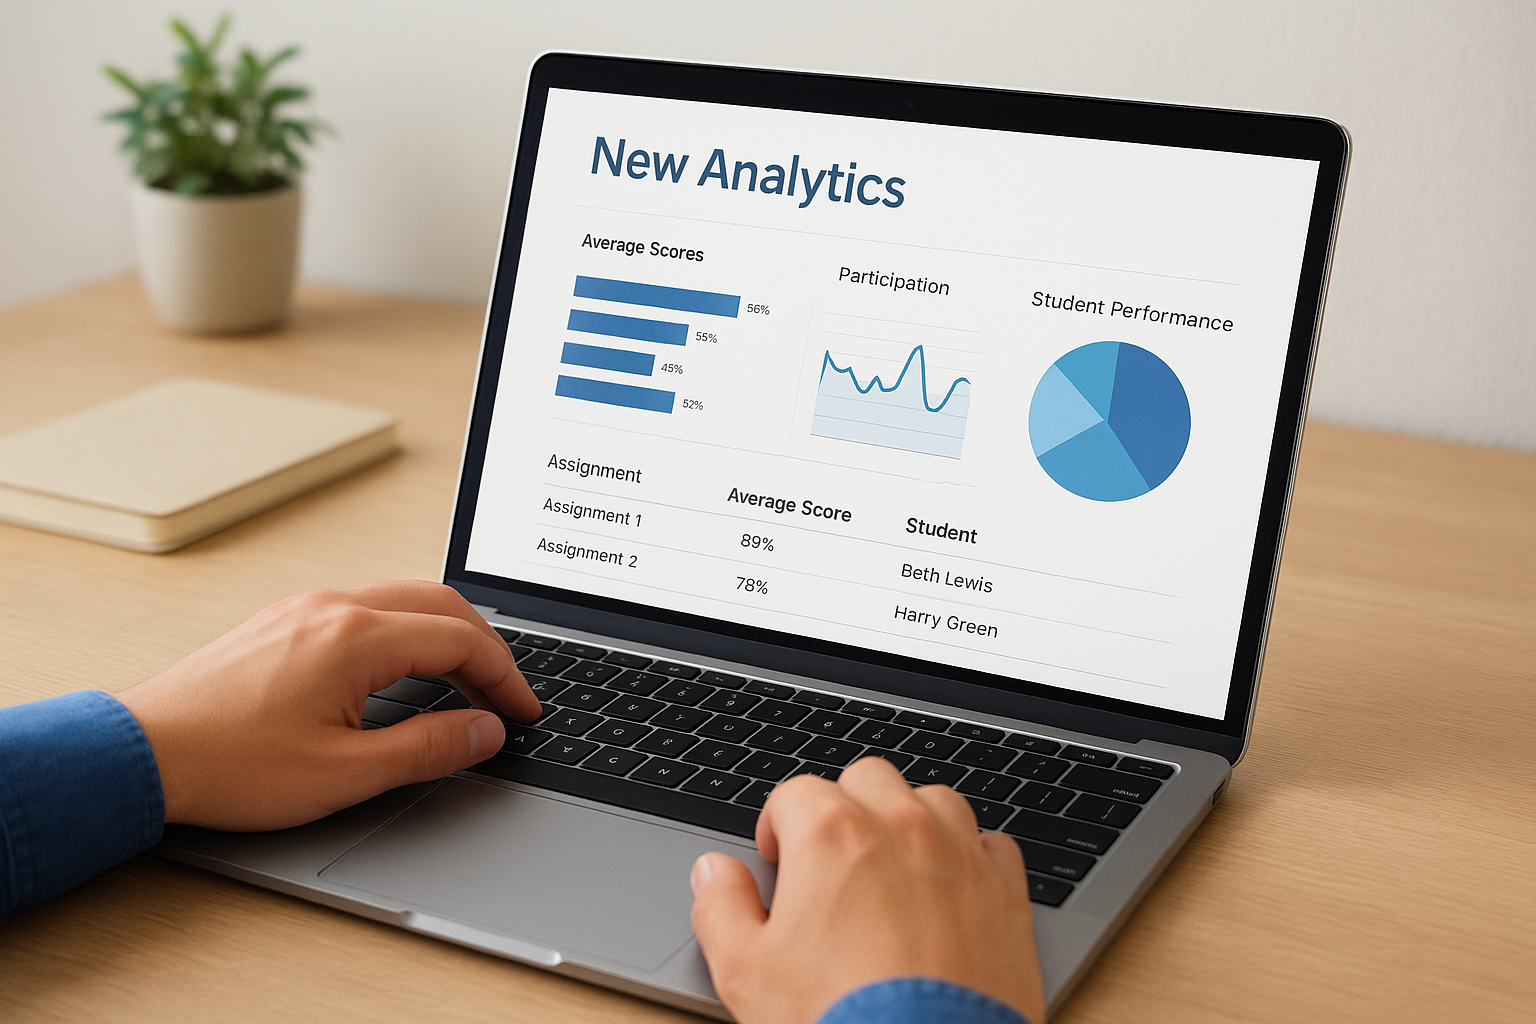
New Analytics replaced the older Course Analytics tool and delivers a significantly more interactive and filterable experience for instructors.
You can also use New Analytics to send direct messages to students who fall below a threshold you define, which means you can act on the data without ever leaving the analytics interface.
Course and Student-Level Reports
Beyond New Analytics, Canvas includes several built-in report types that cover different scopes of data. At the course level, you get summaries of activity, grades, and submission patterns. At the student level, you get a breakdown of each learner’s interactions, including which pages they visited and when.
These reports let you export data to CSV, making it straightforward to run your own analysis or share findings with department heads. Canvas also provides Access Reports, which show you exactly when and how often a student accessed specific course materials, giving you a precise view of engagement patterns that grade data alone would never reveal.
Why Canvas learning analytics matters
Canvas learning analytics gives you something that grades alone never could: visibility into the learning process itself, not just the outcome. When you can see that a student stopped engaging with course materials two weeks before a failed assignment, you have a real chance to intervene. Without that data, you’re always reacting after the fact instead of getting ahead of problems while there’s still time to fix them.
Early visibility into student behavior lets you shift from reactive problem-solving to proactive support.
Connecting Data to Decisions
Instructors and administrators who use analytics consistently tend to make more targeted course adjustments. Instead of guessing why students struggle on a particular assessment, you can trace patterns back to specific content gaps or low engagement windows. That kind of evidence-based decision making reduces wasted effort and improves outcomes across your entire course without requiring a full redesign every semester.
Supporting Institutional Goals
For departments and institutions, analytics create accountability that individual grades simply cannot provide. You can track completion trends, participation rates, and performance patterns across multiple sections or time periods. This gives leadership the data they need to evaluate program effectiveness and direct resources toward the areas that need them most.
Core metrics Canvas tracks and what they mean
Canvas learning analytics surfaces several distinct data points, each telling a different part of the learner’s story. Knowing what each metric actually measures helps you interpret the data correctly and act on it with confidence rather than guessing at what the numbers mean.
Participation and Page Views
Participation score reflects how actively a student interacts with course content, discussions, and submissions, while page views show how often they access specific materials. A high page view count paired with a low participation score can signal that a student is reading but not actually engaging, which is worth investigating before it shows up in their grades.
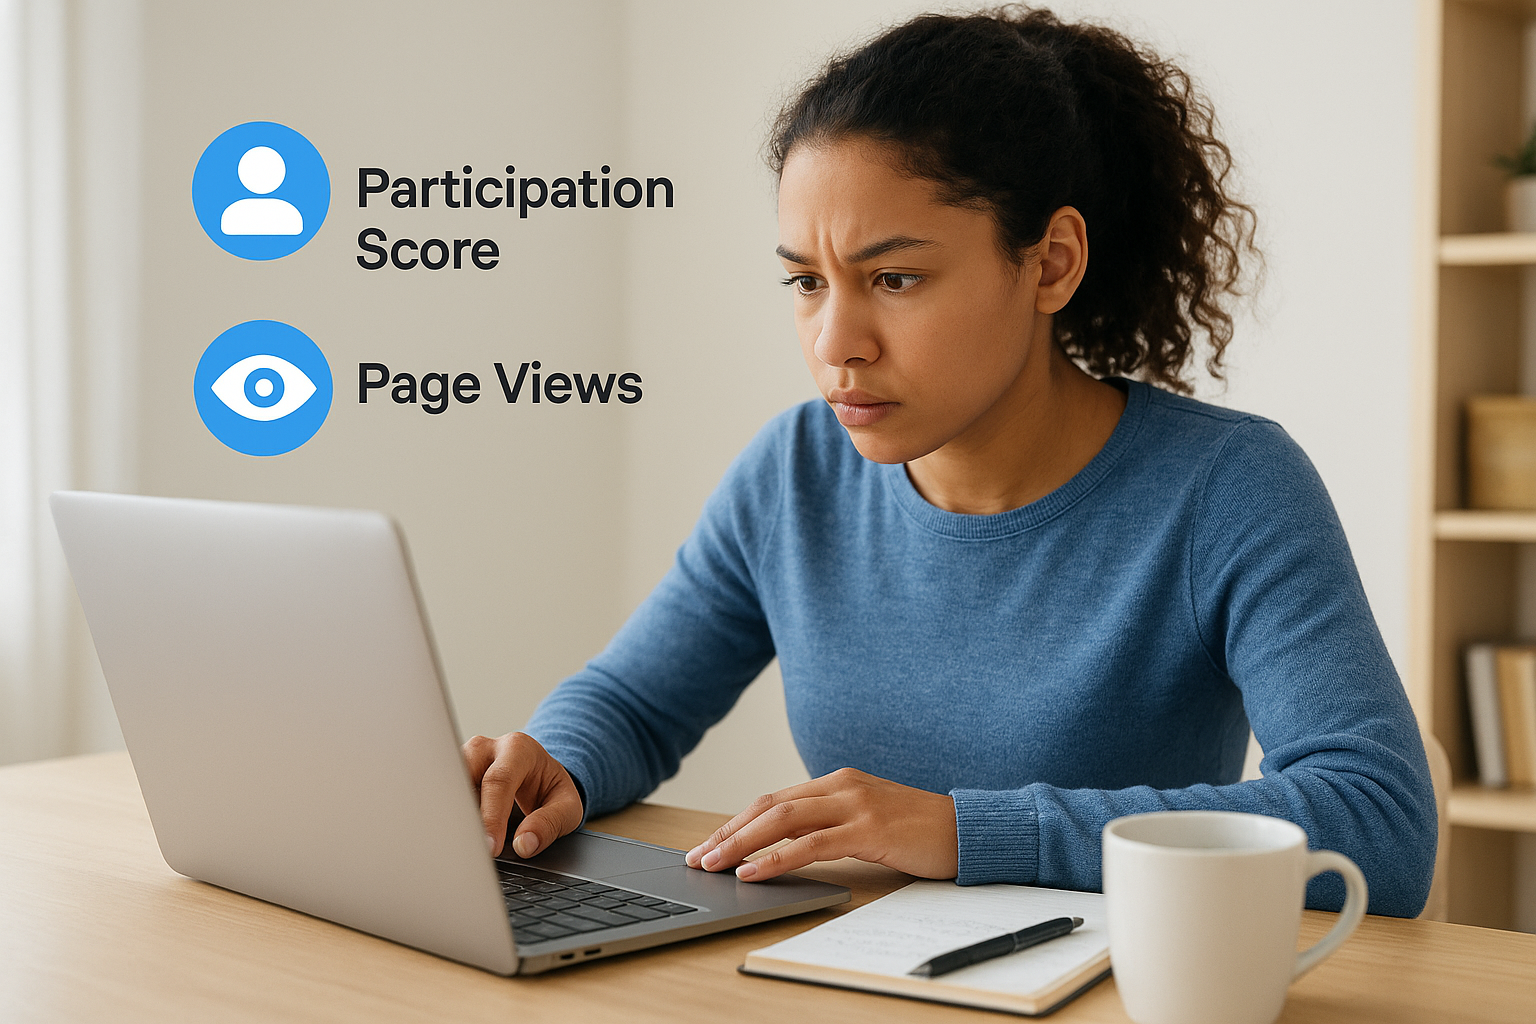
A drop in page views often appears before a drop in grades, giving you an early warning you can act on.
Assignment Scores and Submission Timing
Average assignment scores let you spot which assessments are producing consistent struggles across your class, while submission timing data reveals whether students are pacing themselves or rushing at the last minute. Together, these two metrics give you a much clearer picture of how students actually move through your course, not just what they scored at the end.
How to use Canvas New Analytics and reports
Canvas New Analytics lives inside your course under the Analytics tab, and filtering by student, assignment, or date range helps you zero in on what matters without digging through unrelated data. Once you apply a filter, the dashboard updates in real time to reflect only the data tied to your selection, which keeps your analysis focused and reduces the time you spend interpreting results.
Narrowing your view by date range first makes it much easier to connect engagement dips to specific units or assignment windows.
Working with Student and Course Data
When a student’s data stands out in your dashboard, click their name to pull up their individual analytics view, which shows page views, participation scores, and assignment performance together in one place. You can also send that student a direct message from within the view without switching to a separate tab or tool.
For broader reporting, head to Course Settings and use the Reports section to export your findings as a CSV file. This is how you get canvas learning analytics data into a format that works for spreadsheets or structured summaries you can share with administrators and department leads.
Common use cases and pitfalls to avoid
Instructors and administrators use canvas learning analytics in a handful of high-impact ways. The most common is early intervention: spotting students with dropping page views or participation scores before they fall too far behind to catch up. Teams also use the data to identify which course materials or assessments consistently underperform across sections, then adjust content based on evidence rather than assumptions.
Data loses its value if you collect it but never act on it.
Pitfalls that reduce the value of your data
One of the most frequent mistakes is treating page views as proof of learning. A student can open a page and walk away, so high view counts without corresponding participation or strong scores still warrant a closer look. Avoid drawing conclusions from a single metric in isolation when the full picture requires reviewing multiple data points together.
Another common error is checking analytics only at the end of a term, when there is no time left to intervene. Set a regular review cadence, whether weekly or bi-weekly, so you use the data while it can still make a difference. Responding to engagement dips early keeps more students on track and reduces the number of late-stage interventions you need to manage.
Key takeaways and next steps
Canvas learning analytics gives you a layered set of tools that go well beyond grade tracking. New Analytics, course reports, and student-level data work together to show you where learners engage, where they fall behind, and where your course content needs attention. The value only comes when you review the data consistently and act on what it tells you rather than letting it sit unused.
If you are evaluating whether your current training setup delivers this kind of visibility, start by identifying the gaps in what you can actually see right now. Participation trends, submission timing, and page views each tell a specific part of the learner’s story, and reading them together gives you the complete picture. Whether you stay with Canvas or explore other platforms, strong analytics should be a firm requirement for any LMS you consider.
Take the LMS readiness quiz to find out where you stand and what to prioritize next.