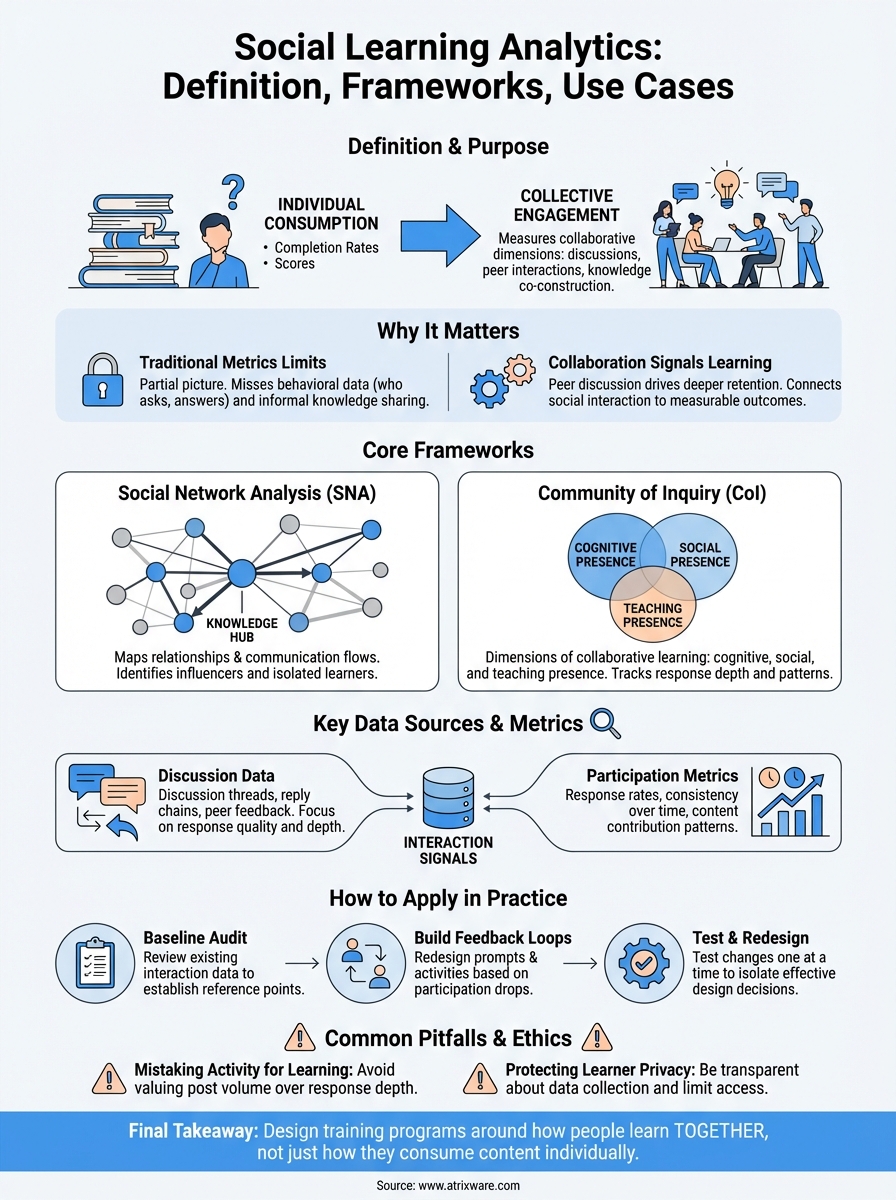
Most organizations track course completions and quiz scores. Those metrics tell you whether someone finished a module, but they reveal almost nothing about how learners interact with each other, share knowledge, or build understanding together. That gap is exactly what social learning analytics addresses. It’s a field focused on measuring the collaborative dimensions of learning: the discussions, peer interactions, and group problem-solving that drive deeper retention and skill development.
For training teams using a platform like Axis LMS, understanding social learning analytics matters because it shifts the evaluation lens from individual consumption to collective engagement. Instead of asking "Did they complete it?" you start asking "How are they learning from each other?", a question that has direct implications for how you design courses, structure discussions, and build community within your training programs.
This article breaks down what social learning analytics actually means, the frameworks researchers and practitioners use to study it, and concrete use cases where it applies, from higher education to corporate training environments. Whether you’re building compliance programs, onboarding workflows, or customer education courses, the concepts here will help you think more critically about measuring the social side of learning.
Why social learning analytics matters
Traditional training metrics focus on individual performance: did the learner pass the assessment, how long did they spend in the module, how many times did they log in. These numbers are easy to collect and easy to report, but they leave out an entire dimension of how people actually develop skills. Humans learn by talking through problems, responding to peers, and refining their thinking through social interaction, not just by absorbing content in isolation.
The limits of traditional learning metrics
When you rely only on completion rates and test scores, you get a partial picture of training effectiveness. A learner can pass every quiz and still fail to apply knowledge on the job, especially in roles that require collaboration, negotiation, or problem-solving. The missing data is behavioral: who is asking questions, who is answering them, and where conversations break down or produce breakthroughs. Without that layer, you cannot identify the informal knowledge-sharing that actually moves teams forward.
Completion data tells you what happened, not how learning occurred or who influenced it.
How collaboration signals stronger learning outcomes
Research in learning science consistently shows that peer discussion and knowledge co-construction produce better long-term retention than passive content consumption. When someone explains a concept to a peer, they reinforce their own understanding and expose gaps they hadn’t recognized. Social learning analytics gives you a structured way to track these interactions and connect them to measurable outcomes and business performance, so you can make design decisions based on evidence rather than assumption.
Applying this analysis to your training programs means you can identify which discussion formats and facilitation approaches actually drive deeper engagement, and which ones produce activity without value.
Core frameworks and approaches
Several research-backed frameworks give structure to how practitioners approach social learning analytics. Understanding these models helps you decide which signals to collect and prioritize, and how to interpret the patterns you find in learner interaction data rather than guessing at what matters.
Social network analysis
Social network analysis (SNA) maps the relationships and communication flows between learners. Applied to training data, it lets you visualize who initiates conversations, who responds, and who sits isolated from the broader learning community. Learners with high connectivity often function as informal knowledge hubs, and identifying them gives you a concrete target for peer facilitation strategies and course redesign.

Mapping interaction networks reveals influence patterns that completion reports will never show.
Community of inquiry
The community of inquiry (CoI) framework breaks collaborative learning into three overlapping dimensions: cognitive presence, social presence, and teaching presence. Each dimension captures a different aspect of how learners engage with each other and with instructors. Social learning analytics operationalizes these dimensions by coding discussion posts, tracking response depth and patterns, and measuring whether peer exchanges in your training environment actually build understanding or just generate activity.
Key data sources and metrics
Effective social learning analytics starts with knowing where to look. Your training platform generates a range of interaction signals that go well beyond login timestamps and quiz completions. The challenge is identifying which data sources actually reflect genuine collaborative activity versus surface-level engagement.

Discussion and interaction data
Discussion threads, reply chains, and peer feedback logs form the core data layer for any social learning analytics program. You can analyze these to measure response rates, identify who drives conversation, and detect threads that generate multi-turn exchanges versus ones that go unanswered. Platforms like Axis LMS capture this interaction data natively, giving you a ready foundation to build on.
The quality and depth of peer replies tells you far more than post volume alone.
Participation and contribution metrics
Beyond raw discussion counts, focus on contribution patterns over time: who participates consistently, who drops off after the first module, and which learners produce content that others engage with repeatedly. These patterns surface influence and knowledge transfer within your learner community. Tracking them helps you spot high-value contributors early and design peer learning structures that put their engagement to work.
Key contribution signals to track:
- Response rate per learner
- Thread initiation vs. reply ratio
- Content that receives follow-up engagement from peers
How to apply social learning analytics in practice
Turning data into action requires a clear process. Before you build dashboards or generate reports, you need to define what collaborative outcomes you actually want to improve and which learner behaviors will serve as your measurable proxy for those outcomes.
Start with a baseline audit
Run a baseline review of your existing interaction data before introducing any new measurement framework. Pull discussion participation rates, peer reply counts, and thread completion patterns from your current training cycles. This gives you a reference point so later changes in your social learning analytics program reflect real shifts in behavior, not just seasonal variation or cohort differences.
Without a baseline, you cannot tell whether your interventions are working or just creating noise.
Build feedback loops into your course design
Apply what you find by redesigning discussion prompts, peer review tasks, and group activities based on where participation drops off or stays shallow. If your data shows that learners initiate threads but rarely respond to peers, restructure the activity to require explicit peer responses before marking a module complete. Test one change at a time so you can isolate which design decisions actually shift the interaction patterns you care about.
Common pitfalls and ethics
Even well-designed social learning analytics programs can produce misleading conclusions or create harm if you approach them carelessly. Before you scale any measurement initiative, it helps to recognize where practitioners consistently go wrong and what ethical boundaries you need to set from the start.
Collecting more data does not automatically mean making better decisions.
Mistaking activity for learning
The most common mistake is treating high post counts and reply volumes as evidence of deep learning. Learners quickly figure out that participation metrics exist, and they optimize for them by posting low-effort responses that technically count. Focus instead on qualitative signals like response depth, follow-up questions, and peer-to-peer knowledge correction, which are harder to game and more directly tied to actual skill development.
Protecting learner privacy
Social interaction data is more sensitive than completion logs because it reveals individual behavior patterns, communication styles, and knowledge gaps that learners may not expect to be monitored. Be transparent with your learners about what you collect and why. Limit access to raw interaction data to those with a direct role in course improvement, and avoid using it to evaluate individual performance without clear policies in place.
Final takeaways
Social learning analytics gives you a practical way to move beyond surface metrics and measure what actually drives learning outcomes: peer interaction, knowledge transfer, and collaborative engagement. The frameworks, data sources, and ethical guardrails covered in this article all point toward the same core principle: design your training programs around how people learn together, not just how they consume content individually.
Start small. Audit your current interaction data, pick one participation metric to improve, and test a targeted design change. As you build confidence in the process, you can layer in network analysis and deeper behavioral signals without overwhelming your team or your learners.
If you’re evaluating whether your current training platform can support this kind of analysis, a good first step is figuring out where you stand today. Take the LMS readiness quiz to understand what your organization actually needs before committing to a direction.