You invest thousands of dollars in training programs each year. Your team spends hours building courses and getting people through them. But when leadership asks if it’s actually working, you struggle to show concrete proof. Completion rates and happy sheet surveys don’t cut it anymore. Executives want to know if training moves the needle on real business outcomes.
The answer lies in measuring what matters. You need a clear framework to track knowledge gains, behavior changes, and business impact. You need KPIs that connect training activities to results like productivity, sales, and compliance. And you need to calculate ROI that proves your programs deliver value.
This guide shows you exactly how to measure training effectiveness from start to finish. You’ll learn which frameworks work best for different situations, how to choose meaningful metrics, when to collect data, and how to calculate ROI that stakeholders actually care about. You’ll also discover how your LMS can automate most of this work and surface insights that help you improve programs over time. By the end, you’ll have a practical approach you can start using today.
What training effectiveness really means
Training effectiveness measures whether your programs actually change behavior and drive business results. It goes far beyond tracking who logged in or who finished a course. You need to know if learners gained new skills, if they apply those skills on the job, and if that application improves outcomes like sales, quality, or compliance. Effective training creates measurable change that you can tie directly to business performance.
Beyond completion rates
Most organizations track the wrong metrics. Completion rates tell you attendance, not impact. A 95% completion rate means nothing if learners forget everything by next week or never use what they learned. The same applies to satisfaction surveys. Learners might rate a course 5 stars because the instructor was funny or the videos looked professional, but enjoyment doesn’t equal effectiveness. You need metrics that show whether knowledge stuck, whether behavior changed, and whether performance improved.
Real training effectiveness answers one question: Did this program make our business better?
The four levels of impact
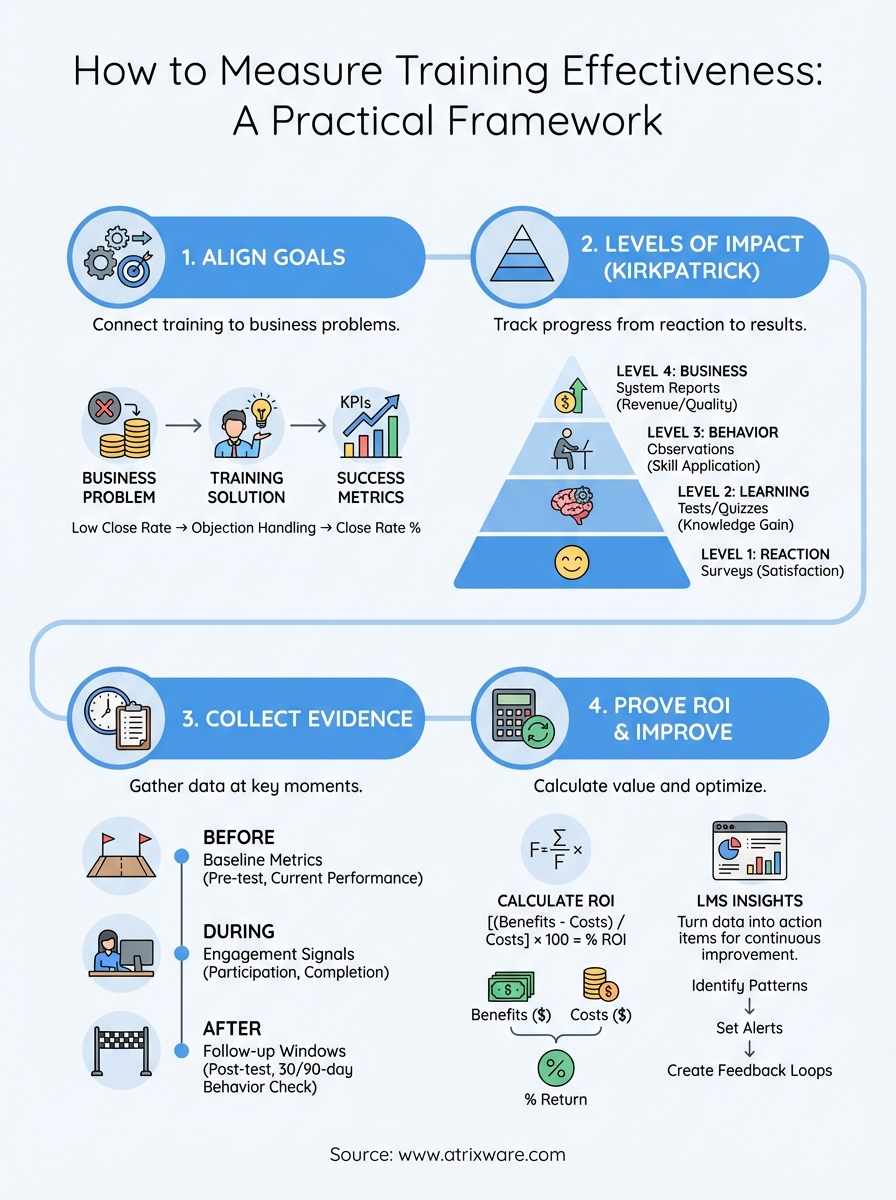
Learning how to measure training effectiveness requires understanding what to measure at each level. Level 1 tracks reaction through surveys that capture immediate learner sentiment. Level 2 measures learning by testing knowledge before and after training. Level 3 evaluates behavior change by observing whether learners apply new skills in their daily work. Level 4 quantifies business results like increased revenue, reduced errors, or faster onboarding. Each level builds on the previous one, and you need data from multiple levels to prove your training works.
Step 1. Connect training goals to business goals
You can’t measure training effectiveness until you know what you’re measuring against. Your training goals must align directly with business objectives from the start. This means identifying specific business problems first, then designing training to solve them. If your sales team misses quota because they can’t handle objections, your training goal becomes "increase objection handling skills to boost close rates by 15%." That’s a measurable outcome tied to revenue, not a vague goal like "improve sales skills."
Start with business problems
Begin by talking to department leaders and stakeholders. Ask them what’s preventing their teams from hitting targets or what problems cost the company money. You might discover that customer support takes too long to resolve tickets, that new hires take six months to reach full productivity, or that compliance violations pile up in certain regions. Each problem becomes a training opportunity with a clear business metric attached. Document these conversations and get agreement on what success looks like in numbers.
Training without business alignment is just activity. Training with alignment is investment.
Map training outcomes to metrics
Create a simple table that connects each training program to specific business metrics. List the business problem in column one, the training solution in column two, and the metrics you’ll track in column three. For sales objection handling training, your metrics might include close rate percentage, average deal size, and sales cycle length. For compliance training, track violation counts, audit scores, and incident reports. This mapping exercise forces you to think through how to measure training effectiveness before you build a single course. It also gives you the exact numbers you need to prove ROI later.
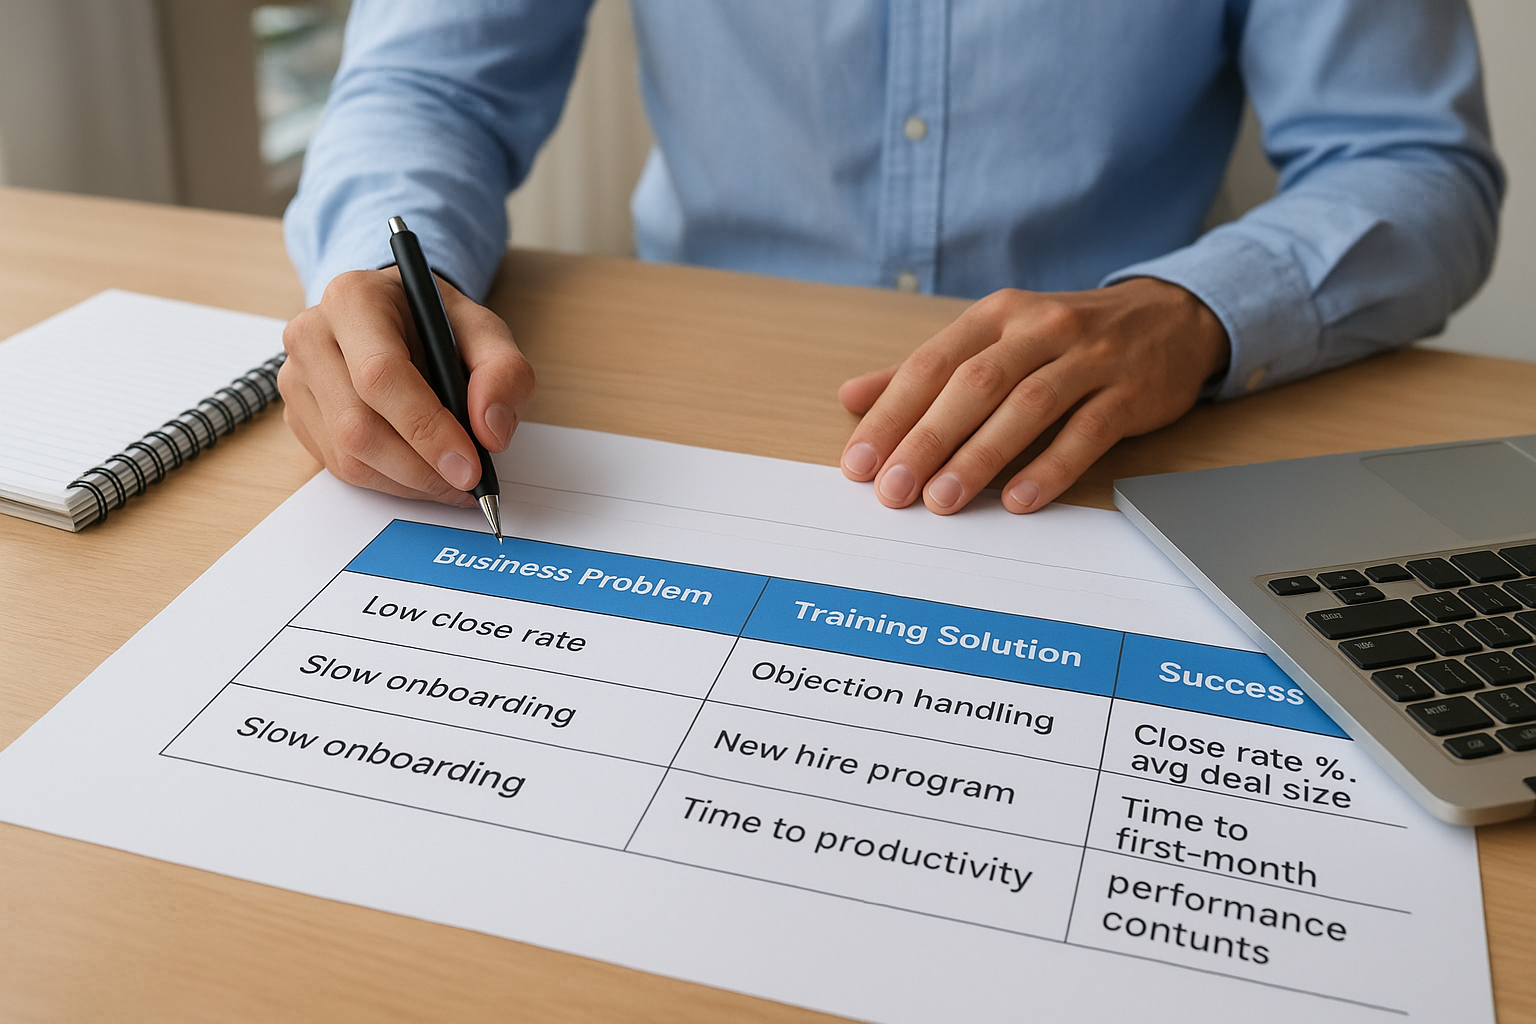
Business Problem → Training Solution → Success Metrics
Low close rate → Objection handling course → Close rate %, avg deal size
Slow onboarding → New hire program → Time to productivity, first-month performance
Step 2. Choose frameworks, methods, and KPIs
You need structure to measure training effectively, not just random data points. The right framework gives you a systematic approach to track progress from initial reaction through business results. Your methods determine how you collect evidence at each stage, while KPIs translate that evidence into numbers stakeholders understand. Pick frameworks and metrics that match your training type and business goals instead of trying to measure everything everywhere.
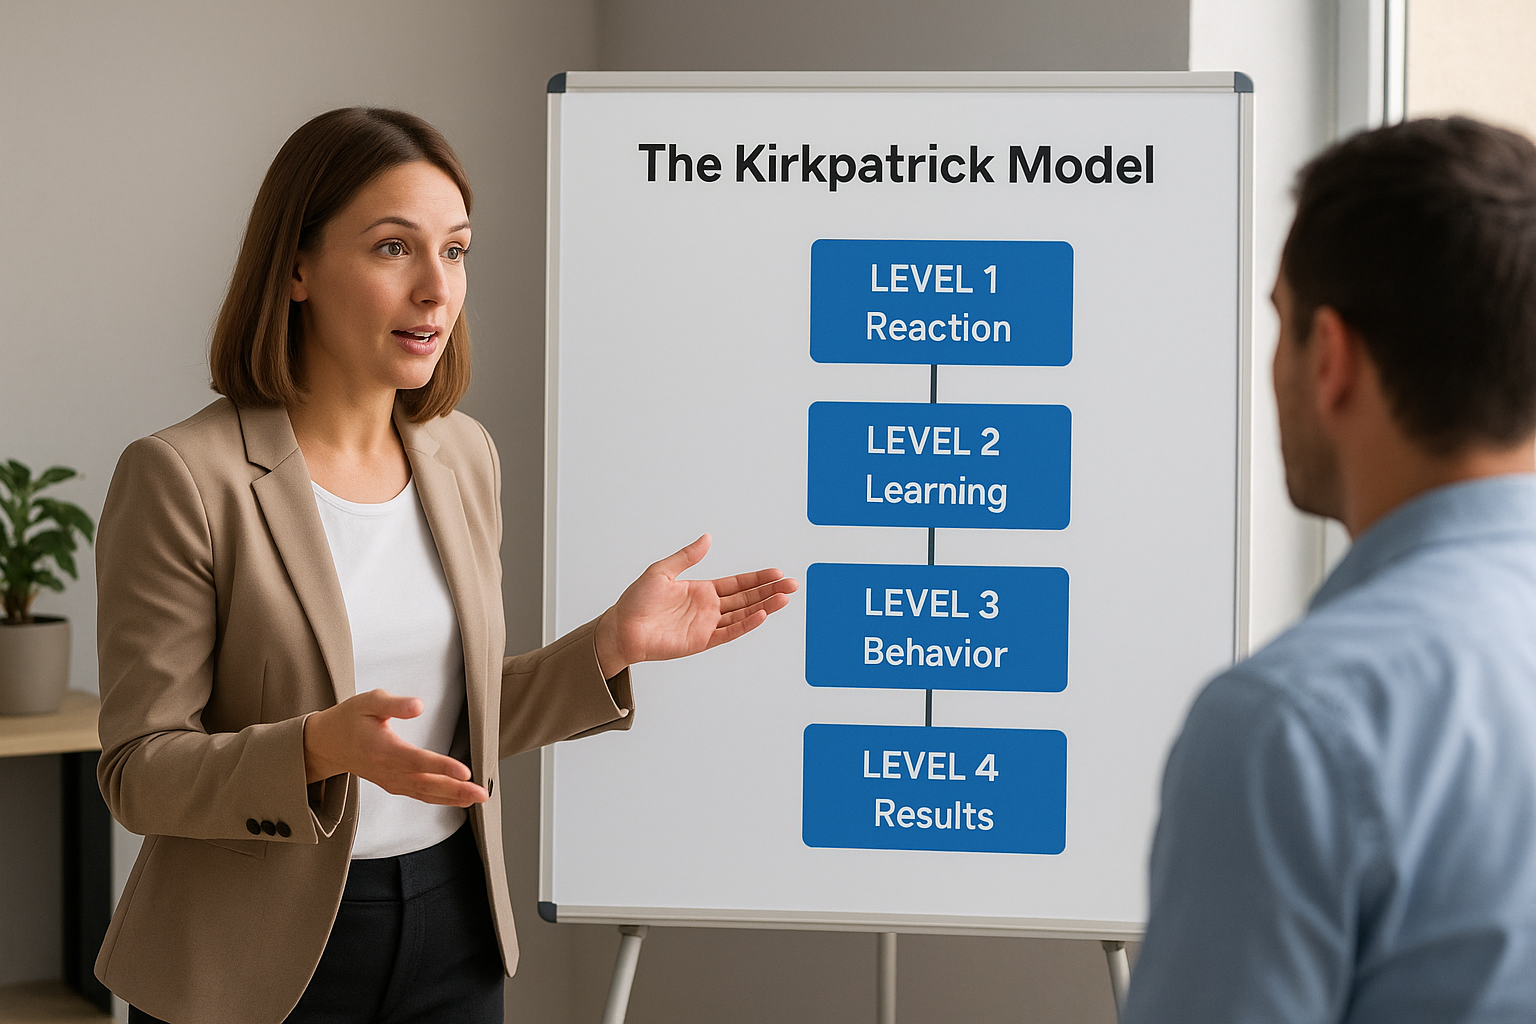
The Kirkpatrick Model in action
The Kirkpatrick Model remains the most practical framework for learning how to measure training effectiveness because it breaks evaluation into four progressive levels. Level 1 measures reaction through post-training surveys that ask about course quality, relevance, and likelihood to apply learning. Level 2 assesses learning using pre-tests and post-tests that show knowledge gains. Level 3 evaluates behavior by tracking whether learners actually use new skills on the job through manager observations, performance reviews, or work samples. Level 4 quantifies business impact by measuring the specific metrics you identified in Step 1, like sales increases, error reductions, or compliance improvements. Start with Level 1 and 2 for every program, then add Level 3 and 4 for high-priority initiatives where proving ROI matters most.
The best framework is the one you’ll actually use consistently across programs.
Methods that capture real evidence
Surveys and questionnaires work well for Levels 1 and 3, asking learners about satisfaction, confidence, and application. Tests and quizzes measure knowledge retention for Level 2, ideally administered both before training and 30 days after to check long-term retention. Manager observations and 360-degree feedback provide Level 3 behavior data by capturing whether new skills show up in daily work. Business system reports deliver Level 4 results by pulling actual performance data from your CRM, support ticketing system, or quality management tools. Mix quantitative methods like test scores with qualitative methods like open-ended survey questions to get the full picture.
KPIs that prove value
Choose 3 to 5 KPIs per training program instead of tracking dozens of metrics that overwhelm you. For employee onboarding, track time to productivity, first-quarter performance ratings, and 90-day retention rate. For sales training, measure conversion rate changes, average deal value, and quota attainment. For compliance training, track completion rates, audit scores, and incident reports. Each KPI should connect directly to a business goal from Step 1 and use data you can actually access and measure consistently over time.
Step 3. Collect data before, during, and after
Timing determines the quality of your training effectiveness data. You need measurements at three critical points to understand what changed because of training versus what existed before it. Collecting data only after training leaves you guessing whether improvements came from your program or other factors. A systematic collection schedule gives you comparison points that prove cause and effect.
Before training: baseline metrics
Pre-training assessment establishes your starting point for every metric you plan to track. Test learners on the knowledge and skills your course will teach using the same assessment format you’ll use post-training. Pull baseline performance data from business systems like your CRM showing current sales numbers, your support platform showing ticket resolution times, or your quality system showing defect rates. Survey learners about their confidence levels and current application of skills. This baseline data becomes your comparison benchmark that shows exactly how much training moved the needle.
Pre-Training Checklist:
□ Knowledge assessment (test/quiz)
□ Skill demonstration or self-rating
□ Current performance metrics from business systems
□ Confidence survey on course topics
□ Manager assessment of current behavior
During training: engagement signals
Track participation metrics that predict success while training happens. Monitor quiz attempts and scores, video completion rates, discussion forum participation, and time spent on activities. Low engagement during training correlates strongly with poor application after, so these signals help you identify learners who need additional support before they finish. Most modern LMS platforms capture this data automatically without requiring manual tracking.
After training: follow-up windows
Schedule data collection at specific intervals instead of checking randomly when you remember. Collect immediate reaction surveys within 24 hours of completion. Re-test knowledge 7 days and 30 days after training to measure retention over time. Survey learners and managers 30 days and 90 days post-training about behavior changes and skill application. Pull business performance metrics quarterly to track sustained impact on the goals you defined in Step 1.
Measure early, measure often, and measure long enough to see real behavior change stick.
Step 4. Calculate ROI and show impact
ROI translates your training results into financial terms that executives and finance teams understand. You’ve collected data showing that training improved knowledge, changed behavior, and boosted performance. Now you need to convert those improvements into dollar values and compare them against what the training cost. This calculation proves whether your program delivered positive returns and helps you secure budget for future initiatives.
The basic ROI formula
The ROI formula divides net benefits by total costs and multiplies by 100 to get a percentage. Net benefits equal the monetary value of improvements minus the total cost of training. ROI = [(Benefits – Costs) / Costs] × 100 gives you a percentage that shows return on investment. A 150% ROI means you got back $2.50 for every dollar spent, while 0% means you broke even.

Example Calculation:
Benefits: $75,000 (increased sales from trained team)
Costs: $25,000 (course development + delivery + time)
ROI: [($75,000 - $25,000) / $25,000] × 100 = 200%
An ROI above 100% proves your training program generated more value than it cost.
Track every cost component
Include all direct and indirect expenses to calculate accurate ROI. Direct costs cover course development, instructor fees, platform subscriptions, and materials. Indirect costs include learner time away from work calculated as hours spent training multiplied by average hourly compensation. Missing costs inflates your ROI and damages credibility when finance reviews your numbers.
Cost Category               | Example Amount
---------------------------|---------------
Course development         | $8,000
LMS platform fees          | $3,000
Instructor/facilitator     | $5,000
Materials and resources    | $2,000
Learner time (50 hours)    | $7,000
Total Training Investment  | $25,000
Convert improvements to dollars
Transform performance gains into monetary values using business data and conservative estimates. If sales training increased close rates from 20% to 25%, multiply the additional closed deals by average deal value. If compliance training reduced violations from 10 to 2 per quarter, multiply avoided violations by the average cost per incident including fines and remediation. Use historical data and work with finance to validate your conversion assumptions.
Build a simple impact dashboard
Present ROI alongside supporting metrics that show the complete story. Create a one-page summary with ROI percentage at the top, followed by key performance improvements, cost breakdown, and business impact examples. Include before-and-after comparisons for your most important KPIs using simple bar charts or tables that non-technical stakeholders grasp immediately.
Step 5. Improve programs using LMS insights
Your LMS captures thousands of data points about how learners interact with training content, and this information reveals exactly where programs succeed or fail. Smart organizations use these insights to continuously improve instead of waiting months to review results. Your measurement process shouldn’t end after calculating ROI. It should feed directly into program updates that boost effectiveness with each iteration.
Turn data into action items
Identify patterns in completion rates, quiz scores, and time-on-task metrics to spot content that confuses or disengages learners. If 60% of learners abandon a module at the same point, that section needs restructuring. Review assessment data to find questions that most learners answer incorrectly, which signals unclear instruction or knowledge gaps your course didn’t address. Create a simple review cycle where you analyze LMS reports monthly and update one to two courses based on what the data reveals.

Low Performance Indicators → Improvement Actions
High drop-off rate on Module 3 → Split into shorter segments
Quiz question 7 fails 70% → Add video explanation before quiz
Average completion time 2x estimate → Remove redundant content
Your LMS shows you exactly where learners struggle if you look at the right reports.
Set up automated alerts
Configure your LMS to send notifications when specific thresholds trigger instead of checking dashboards manually. Set alerts for completion rates below 80%, average quiz scores under 70%, or when learners haven’t logged in for 10 days. These automated signals let you intervene quickly with additional resources, coaching, or content revisions before problems compound.
Create feedback loops
Survey learners immediately after training and again 60 days later to understand what worked and what didn’t. Ask specific questions about content clarity, relevance to their job, and obstacles to applying new skills. Share aggregated feedback with course developers and subject matter experts quarterly so they understand how to measure training effectiveness beyond completion numbers and can make targeted improvements that address real learner needs.
Bringing it all together
You now have a complete framework for how to measure training effectiveness at every level. Start by connecting training goals to business objectives, choose frameworks and KPIs that match your programs, collect baseline and post-training data, calculate ROI that proves value, and use LMS insights to improve continuously. Each step builds on the previous one to create a measurement system that satisfies executives while helping you optimize programs.
The key to success lies in consistency and automation. Apply this framework across all your training initiatives instead of measuring some programs but not others. Track the same KPIs over time so you can spot trends and prove long-term impact. Modern LMS platforms handle most measurement work automatically, from tracking engagement metrics to generating ROI reports that connect training to business outcomes. See these capabilities firsthand with a hands-on Axis LMS admin demo that shows you exactly how to track and prove training effectiveness.