
Every training program generates data, course completions, quiz scores, time spent on modules, login frequency. But most organizations collect this data without actually doing anything useful with it. That’s where learning analytics explained as a discipline becomes essential. It’s the practice of measuring, collecting, and analyzing learner data to understand what’s working, what isn’t, and what to change next.
For HR managers, training leads, and compliance officers, learning analytics answers questions that gut instinct alone can’t. Which modules are learners dropping out of? Are employees retaining what they need for compliance certifications? Is your onboarding program actually accelerating time-to-productivity, or just checking a box? These are operational questions with real business consequences, and learning analytics gives you the framework to answer them.
At Atrixware, we built Axis LMS with robust reporting and tracking tools specifically so organizations can move from guessing to knowing. Our platform captures learner activity across courses, assessments, and certifications, giving administrators the data foundation that learning analytics depends on.
This article breaks down what learning analytics is, the methods and metrics behind it, and how organizations apply it across employee training, compliance, and customer education. Whether you’re new to the concept or looking to get more from the data your LMS already collects, this guide covers the full picture from definition to practical use cases.
What learning analytics covers and what it is not
Learning analytics sits at the intersection of data collection, behavioral analysis, and instructional improvement. At its core, it means capturing data generated by learners as they interact with training content, then using that data to draw conclusions about learning effectiveness. When people ask to have learning analytics explained, they often underestimate the scope: it spans individual learner behavior all the way up to organization-wide training outcomes, and it only becomes useful when you treat it as an ongoing practice rather than a one-time report.
What learning analytics actually covers
Learning analytics covers four main areas: learner behavior, performance outcomes, content effectiveness, and program-level trends. Learner behavior data includes how long someone spent on a module, how many attempts they made on a quiz, and at what point they abandoned a course. Performance outcome data tells you whether learners actually retained what they needed to learn, measured through assessment scores, certification pass rates, and post-training job performance indicators.
Content effectiveness is a layer that many organizations overlook. If 60 percent of your learners abandon a particular video module at the same timestamp, the problem likely lives in the content itself, not the learner. Program-level trend analysis connects all of these areas together, showing you whether your overall training investment is moving the needle on business goals like compliance rates, onboarding speed, or customer retention. Each layer feeds into the others, which is why tracking a single metric in isolation rarely gives you accurate conclusions.
Learning analytics is most useful when it connects individual learner data to organizational outcomes rather than reporting on each in isolation.
What learning analytics is not
Learning analytics is not the same as basic LMS reporting, even though both draw from the same data. Standard LMS reports tell you what happened: who completed which course, when they logged in, and what score they received. Learning analytics takes that raw output and asks why it happened and what you should do next. The distinction matters because organizations often mistake a completion report for proof of learning, when completion alone says nothing about knowledge retention or behavior change on the job.
Treating learning analytics as a surveillance system creates serious trust problems with learners and corrupts the data you actually need. The goal is to improve training outcomes, not to monitor employees’ every action with punitive intent. When your organization frames analytics around supporting learner development rather than catching underperformers, people engage more honestly with training content, which produces more accurate and actionable data for you to work with.
The scope in practice
Most learning analytics programs start narrower than you might expect, and that’s a good thing. A compliance training team might focus entirely on certification completion rates and re-certification timing to close regulatory gaps before an audit. A sales enablement team might track which product knowledge modules correlate with higher deal close rates. A customer education team might measure whether course completion reduces support ticket volume over a given quarter.
Each of these represents a focused, specific application of learning analytics rather than a sprawling data project. You do not need to measure everything at once to get real value. Starting with one or two business questions, identifying the data you need to answer them, and building incrementally from there is both practical and effective. Learning analytics scales with your organization’s maturity, and starting focused beats waiting until you have a perfect data infrastructure in place.
Why learning analytics matters in training
Training is one of the largest operational investments an organization makes outside of headcount. US businesses spend tens of billions on workplace learning every year, yet most cannot clearly demonstrate whether that spending produces measurable business outcomes. That gap between investment and evidence is exactly why having learning analytics explained and operationalized inside your training program matters. You need data to defend your budget, improve your content, and connect training to the real outcomes your organization cares about, whether that’s compliance rates, onboarding speed, sales performance, or customer retention.
The cost of training without data
When you run a training program without analytics, decisions default to gut instinct and the loudest feedback in the room. That approach means ineffective content stays in rotation because no one has flagged it with hard evidence, while high-impact programs get cut because no one tracked their results. A course that learners find dry or slow might still produce strong knowledge retention and measurable job performance gains. Without measurement, you lose that distinction entirely, and your program gets worse instead of better over time.
The organizations that improve training fastest treat data as a feedback loop, not a report card they file away after each quarter.
Your budget decisions become significantly stronger when you can point to specific outcomes. If a structured onboarding program reduces time-to-productivity by two weeks on average, you have a defensible case for expanding it. If a costly external certification program shows no measurable correlation with downstream performance, you have an equally clear case for replacing it with something that demonstrably works. That kind of evidence turns training conversations from subjective debates into straightforward decisions.
Compliance and regulatory stakes
For organizations operating under regulatory requirements, learning analytics functions as a direct risk management tool. Proving that employees completed required training is not enough when a regulator asks whether that training was effective. Documentation of assessment scores, remediated knowledge gaps, and re-certification timing gives auditors evidence that your compliance program has real substance behind it, not just logged completions that no one reviewed.
Missing a re-certification deadline in a regulated role carries real legal and financial exposure for your organization. Analytics-driven tracking lets you build automated alerts that surface compliance risks weeks before they become violations, giving your team time to act rather than scramble. That shift from reactive to proactive compliance management is one of the clearest, most immediate returns you get from investing seriously in learning analytics.
Data sources and tracking standards
Learning analytics explained at a practical level starts with understanding what data you actually have and where it comes from. Your LMS is the primary source, but it doesn’t operate in isolation. Learner activity data, assessment results, and completion records all originate inside the platform, while external systems like HR software, CRM tools, and job performance databases can supply the context you need to connect training outcomes to real business results. Getting clear on your data sources before you build any reporting infrastructure saves you from drawing conclusions on incomplete information later.
Where your LMS data comes from
Your LMS captures data at several levels: learner interactions with content (clicks, time on page, video play and pause events), assessment performance (scores, attempt counts, pass or fail status), and administrative records (enrollment dates, completion timestamps, certification expiration dates). Each layer tells a different part of the story. Interaction data shows engagement patterns, assessment data shows knowledge acquisition, and administrative records track compliance obligations.
Beyond the LMS itself, HR systems hold the workforce context that makes training data meaningful. Linking job role, department, tenure, and performance review data to your LMS records lets you ask questions like whether certain roles show consistently lower pass rates on compliance assessments, or whether time spent in onboarding training correlates with 90-day performance scores. Without that connection, your training data floats in isolation from the business outcomes you actually care about.
The richest learning analytics programs connect LMS data to at least one external business system, whether HR, CRM, or support ticket volume, to close the gap between training activity and measurable outcomes.
Tracking standards: xAPI, SCORM, and cmi5
Three tracking standards govern how learning platforms collect and report learner data, and each has a different scope. SCORM (Sharable Content Object Reference Model) is the older, most widely supported standard and tracks basic interactions like completion status and quiz scores within a course. It works well for traditional e-learning but has real limits: it only tracks what happens inside a course window and requires a specific LMS connection to function.
![]()
xAPI (Experience API) extends tracking well beyond the course window. It records learning experiences from mobile apps, simulations, job aids, and even offline activities by sending structured data statements to a Learning Record Store (LRS). cmi5 combines xAPI’s flexibility with SCORM’s launch and communication rules, giving you a modern standard that works reliably across platforms while capturing a much broader range of learner activity. If your organization is building a serious analytics program, xAPI or cmi5 gives you the data depth that SCORM alone cannot provide.
Metrics that actually show learning impact
Not every metric your LMS generates is worth tracking. Completion rates and login frequency are the metrics most organizations default to, but they measure activity, not learning. When learning analytics explained as a discipline pushes you toward impact, the metrics you prioritize should connect directly to knowledge retention, behavior change, and downstream business performance. Choosing the right metrics from the start keeps your program focused and prevents you from drowning in data that doesn’t drive decisions.
Assessment and knowledge retention scores
Assessment scores give you the most direct read on whether learners actually absorbed the material. Pass rates and average scores per module tell you which content is landing and which needs revision. A module where 40 percent of learners fail on the first attempt is not a failure of the learners; it signals that the content, the assessment design, or both need work.
Knowledge retention scores, measured through spaced post-training assessments taken days or weeks after course completion, show whether learning stuck or faded quickly. Most organizations skip this step entirely and assume a passing score on the day of training is sufficient evidence of learning. That assumption breaks down fast, especially for compliance-critical roles where knowledge gaps carry regulatory or safety consequences.
Retention scores taken two to four weeks after training completion give you a far more accurate picture of real knowledge acquisition than same-day assessment results.
Time-to-competency and completion patterns
Time-to-competency measures how long it takes a new hire or transferring employee to reach the performance standard their role requires. Tracking this metric before and after a training program change tells you directly whether your learning design is accelerating readiness. If your average time-to-competency drops by a week after restructuring your onboarding content, you have a concrete, defensible result to point to.
Completion patterns and drop-off points sit one level below time-to-competency and feed directly into it. When a large share of learners abandon a course at a specific module, that pattern reveals a friction point in the learning path. Identifying and fixing that module reduces your average completion time and, by extension, improves your time-to-competency metric overall.
Business outcome correlations
The most powerful metrics in any learning analytics program connect training activity to business results: compliance audit scores, customer satisfaction ratings, sales close rates, and support ticket volume. These correlations require you to link your LMS data to an external system, but the payoff justifies the setup. When you can show that learners who complete a specific course perform measurably better on a downstream business metric, you’ve moved from reporting on training to demonstrating its value.
Core methods: descriptive to prescriptive
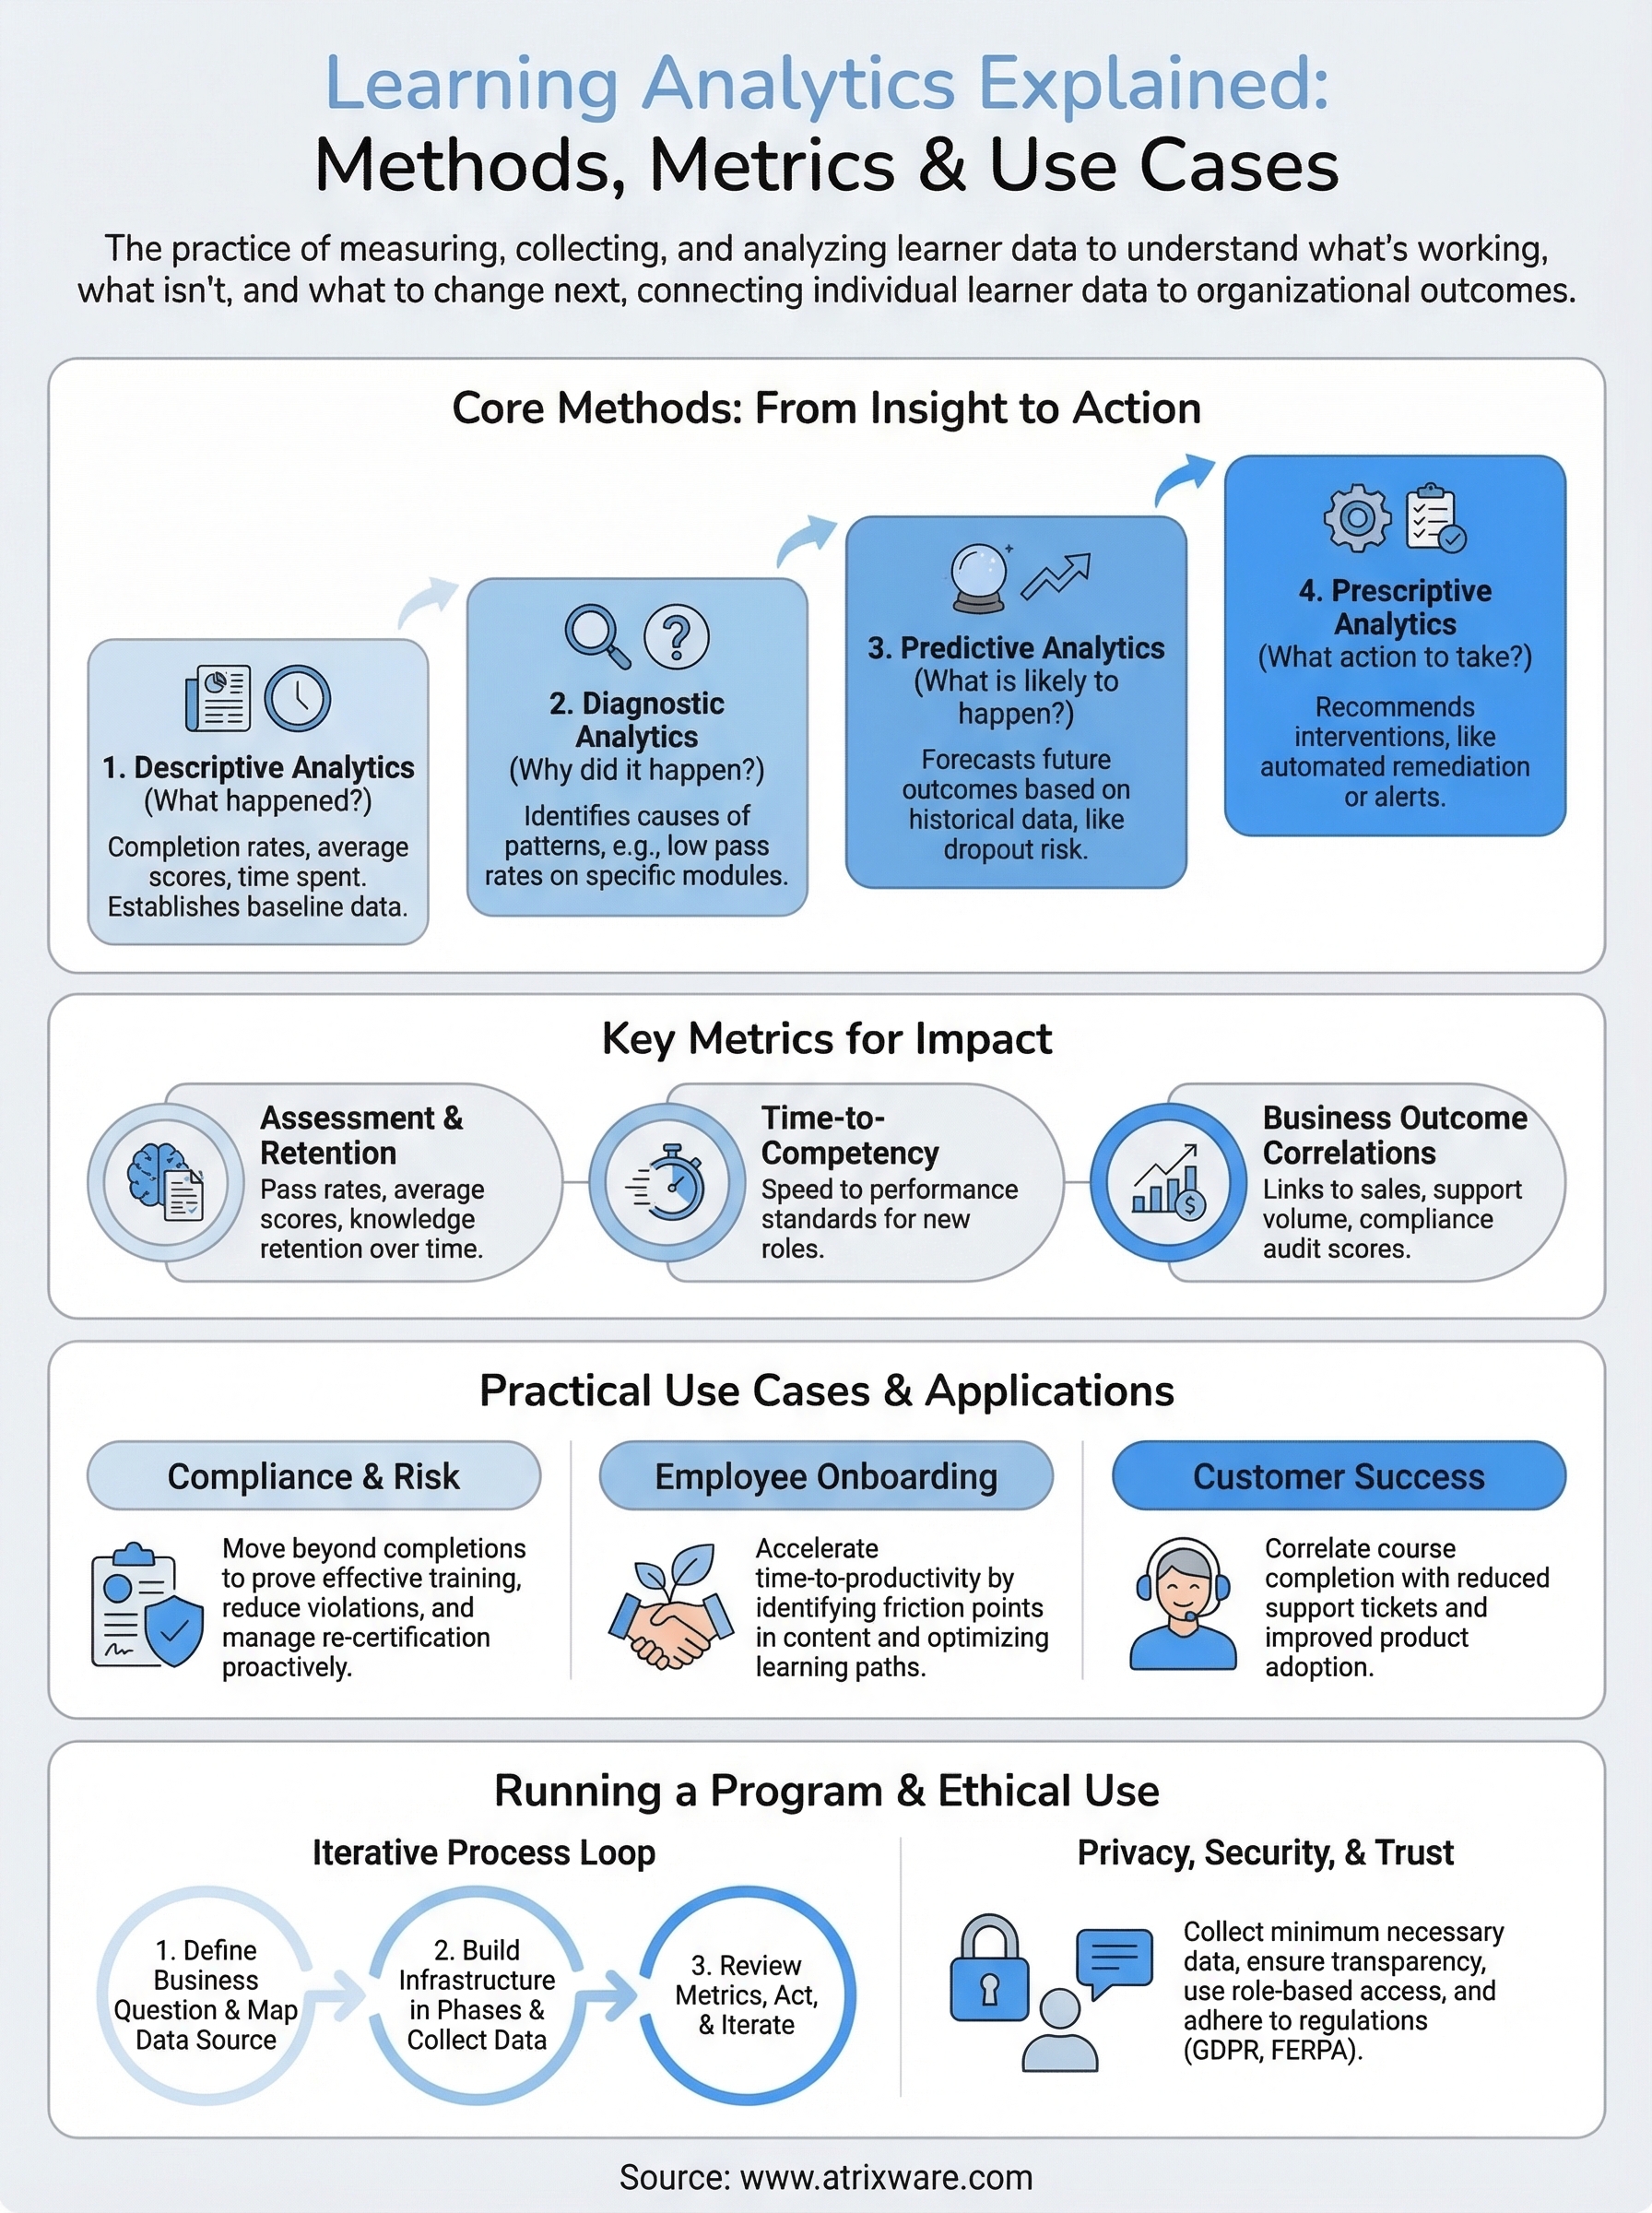
Learning analytics explained as a practice runs across four distinct analytical methods, each building on the one before it. Descriptive analytics tells you what happened, diagnostic analytics tells you why it happened, predictive analytics tells you what is likely to happen next, and prescriptive analytics tells you what action to take. Most organizations start at the descriptive level and treat it as the destination. The real value comes from progressing through all four, because each layer produces a different kind of decision.

Descriptive and diagnostic analytics
Descriptive analytics produces the reports your LMS generates automatically: completion rates, average assessment scores, login frequency, and time spent per module. These numbers establish a baseline and answer the question of what your learners did. On their own, they are not actionable, but they are the raw material every other method depends on. Without accurate descriptive data, the layers that follow will lead you to wrong conclusions.
Diagnostic analytics takes that baseline and asks why certain patterns exist. If your descriptive data shows that a particular compliance module has a 35 percent pass rate on the first attempt, diagnostic analysis looks at which questions learners get wrong most often, whether the content preceding those questions addresses those concepts clearly, and whether specific learner segments fail at a higher rate than others. This method identifies the cause rather than just the symptom, which is the step that makes intervention actually effective instead of arbitrary.
Jumping straight to solutions without first diagnosing the cause of a performance gap almost always produces training content that fixes the wrong problem.
Predictive and prescriptive analytics
Predictive analytics uses historical learner data to forecast future outcomes. If learners who miss their first two assignments in an onboarding program have an 80 percent dropout rate in the third week, your system can flag those learners early and give your training team time to intervene before the dropout occurs. This method requires enough historical data to identify reliable patterns, but even a single year of LMS records gives you a workable foundation for basic predictive modeling.
Prescriptive analytics moves from forecasting to recommending. It tells you exactly what intervention to apply based on the predicted outcome, whether that means triggering an automated reminder, routing a learner to a remediation module, or alerting a manager that a certification deadline is at risk. Prescriptive methods close the loop between data and action, which is the point where learning analytics generates its clearest return on investment for your organization.
How to run a learning analytics program
Running a learning analytics program does not require a dedicated data science team or a complete overhaul of your existing tools. What it requires is a clear starting point and a process you actually stick to. Most programs fail not because the technology is wrong, but because they launch without defined business questions, collect too much data at once, and never close the loop between insight and action. Starting structured and staying focused gets you results faster than building the perfect infrastructure before you begin.

Start with a business question, not a data strategy
The most common mistake organizations make when implementing learning analytics explained in practice is treating data collection as the goal rather than the means. Before you configure a single report, write down the two or three specific questions you need your training data to answer. Strong starting questions look like: "Does our compliance training actually reduce violation rates?" or "Which onboarding modules correlate with faster time-to-competency in the first 90 days?" Those questions tell you exactly which data to collect and which metrics to track, instead of pulling everything and hoping something useful surfaces.
A program built around one clear business question produces faster, more actionable results than a program built around comprehensive data collection with no defined purpose.
Once you have your questions, map each one to a specific metric and data source. If your question involves compliance pass rates, you need assessment scores from your LMS and audit outcome records from your compliance system. If it involves onboarding effectiveness, you need completion timestamps and manager performance ratings from your HR platform. This mapping exercise reveals integration gaps early so you can address them before they block your analysis.
Build your data infrastructure in phases
Your data infrastructure does not need to be complete before you start drawing insights. Phase one connects your LMS reporting to your first business question and produces a baseline. Phase two adds the external data source that gives that baseline context, such as an HR system or CRM. Phase three builds the automated alerts and dashboards that surface trends without requiring manual report pulls every week.
Each phase should produce a usable output before you move to the next one. This keeps your team from spending six months on setup with nothing to show for it, and it lets you validate that the data you are collecting is actually answering the questions you started with.
Review, act, and iterate on a fixed cycle
Set a fixed review cadence, whether monthly or quarterly, where your training team looks at the metrics you defined, identifies the patterns worth acting on, and makes one or two specific content or delivery changes. Document what you changed and measure whether the relevant metric shifted in the next cycle. This iterative loop is what separates organizations that improve their training over time from those that generate reports nobody reads.
Privacy, security, and ethical use
When you build a learning analytics program, you handle personal data about real people. That data carries legal obligations and ethical responsibilities that go beyond simply locking down your LMS with a strong password. Learning analytics explained in practice means understanding not just how to collect and use data, but how to do it in a way that respects the people generating it. Getting this wrong damages learner trust, exposes your organization to regulatory penalties, and corrupts the quality of the data your decisions depend on.
Define what you collect and why
Your data collection should follow the principle of minimum necessary data: collect only what you need to answer your defined business questions and nothing more. Every data point you gather on a learner should have a clear, documented purpose tied to a specific training outcome. If you cannot explain why you are collecting a particular metric, you should not be collecting it.
Regulations like GDPR and FERPA set legal floors for how you handle learner data, including requirements for consent, data storage limits, and the right of individuals to access or request deletion of their records. Even if your organization operates primarily under US employment law rather than GDPR, building your program against those standards gives you a stronger foundation than the minimum your local regulation requires. That level of discipline also makes it easier to respond quickly when a regulator or auditor asks how you handle personal training data.
Communicate clearly with learners
Learners engage more honestly when they understand what data you collect and how you use it. A brief, plain-language disclosure at the start of a training program, explaining that their activity data improves course content and tracks compliance requirements, removes the uncertainty that makes people disengage or game their results. Transparency is not just an ethical requirement; it directly improves the accuracy of the data your entire program depends on.
Learners who understand why their data is collected and how it benefits them engage more authentically with training, which gives you cleaner and more reliable data to work with.
Securing your LMS with role-based access controls ensures that only the people who need to see specific learner records can access them. A compliance officer does not need visibility into every learner’s full activity log, and a department manager does not need to see assessment scores from outside their team. Restricting access by role reduces your exposure if a breach occurs and keeps your use of learner data clearly bounded by its legitimate purpose.
Key takeaways
Learning analytics explained as a practice comes down to one core idea: data your training program already generates can tell you exactly what to fix, what to keep, and what to build next. The methods range from descriptive reporting to prescriptive recommendations, and the metrics that matter most connect learner behavior to real business outcomes rather than just tracking completions.
Your organization does not need a massive data infrastructure to start. Pick one business question, map it to the right data source, and build from there in phases. Protect learner data with clear policies and role-based access controls, and run a fixed review cycle so your insights actually drive content changes over time.
Seeing how a well-built LMS captures and surfaces this data makes the process concrete. Axis LMS reporting tools give you the foundation a serious analytics program depends on. Start your free Axis LMS admin demo and explore the reporting tools firsthand.