
SAP’s SuccessFactors Learning Analytics gives organizations a way to pull structured data from their training programs, completion rates, assessment scores, compliance status, and more. On paper, that sounds straightforward. But knowing which metrics actually matter, how to build reports that drive decisions, and whether your training spend is producing real results? That’s where most teams get stuck.
Understanding what SuccessFactors Learning Analytics can (and can’t) do is the first step toward measuring training effectiveness with any confidence. The platform offers a range of built-in reports and dashboards, but getting value from them requires knowing how to connect learning data to business outcomes, not just generating charts for the sake of it. Whether you’re evaluating SuccessFactors or comparing it against alternatives, the core question is the same: are your people actually learning, and can you prove it?
At Atrixware, we build Axis LMS with comprehensive reporting and analytics baked in, so we think about training measurement constantly. This article breaks down the key metrics, reporting capabilities, and ROI considerations within SuccessFactors Learning Analytics, giving you a clear picture of what to expect and how to evaluate any LMS analytics toolset effectively.
What SuccessFactors Learning Analytics is
SuccessFactors Learning Analytics refers to the reporting and data layer built into the SAP SuccessFactors Learning module. It gives administrators and L&D teams a way to collect, organize, and interpret data generated by their training programs, from who completed a course to how learners scored on assessments. Rather than a standalone tool, it functions as a reporting and insight capability embedded within the broader SuccessFactors Human Experience Management (HXM) suite.
The data it collects
The system captures data across several dimensions of the learning experience. Completion data tracks whether learners finished assigned courses or curricula. Assessment data records scores, pass/fail rates, and the number of attempts. Beyond those basics, the platform also logs time spent in learning content, assignment due dates versus actual completion dates, and compliance certification status. This gives administrators a layered picture of learner behavior rather than just a binary "done or not done" view.
The real value in learning data comes not from tracking completions, but from connecting those completions to what happens in the business afterward.
Where it sits within SAP SuccessFactors
SuccessFactors Learning Analytics does not operate in isolation. It connects directly to SAP SuccessFactors People Analytics, which pulls workforce data from across HR modules including performance management and succession planning. That connection matters because it allows you to cross-reference training activity with broader talent data, such as whether employees who completed a leadership curriculum later received higher performance ratings. The integration with the larger SAP ecosystem means the data you gather from training can inform headcount decisions, skills gap analysis, and workforce planning. For organizations already running SAP at the enterprise level, this integration is a meaningful advantage. For those without that broader SAP footprint, the reporting capabilities are more limited in scope and require more manual work to connect learning outcomes to business performance.
Why learning analytics matters for L and D
L&D teams have historically struggled to justify training budgets because they could only report on activity: courses launched, hours logged, completions recorded. Learning analytics changes that by shifting the conversation from "what did people do" to "what did training actually produce." Without structured data, you’re making program decisions based on instinct, and that puts your entire training investment at risk.
When L&D can connect training data to performance outcomes, it stops functioning as a cost center and starts acting as a strategic business driver.
Moving beyond activity tracking
Most organizations start collecting learning data because compliance demands it: regulators need proof that employees completed required training. But the same data infrastructure also enables deeper analysis. You can identify which learning formats produce better assessment scores, which teams consistently miss development milestones, and where skill gaps exist before they damage business performance.
When leadership asks whether training is working, a list of completions is not a credible answer. SuccessFactors learning analytics gives you concrete numbers to present: pass rates, time-to-competency trends, and correlations between training activity and employee performance data. Those numbers let you make an evidence-based case for expanding programs that work and cutting the ones that don’t.
Metrics that show adoption, progress, and impact
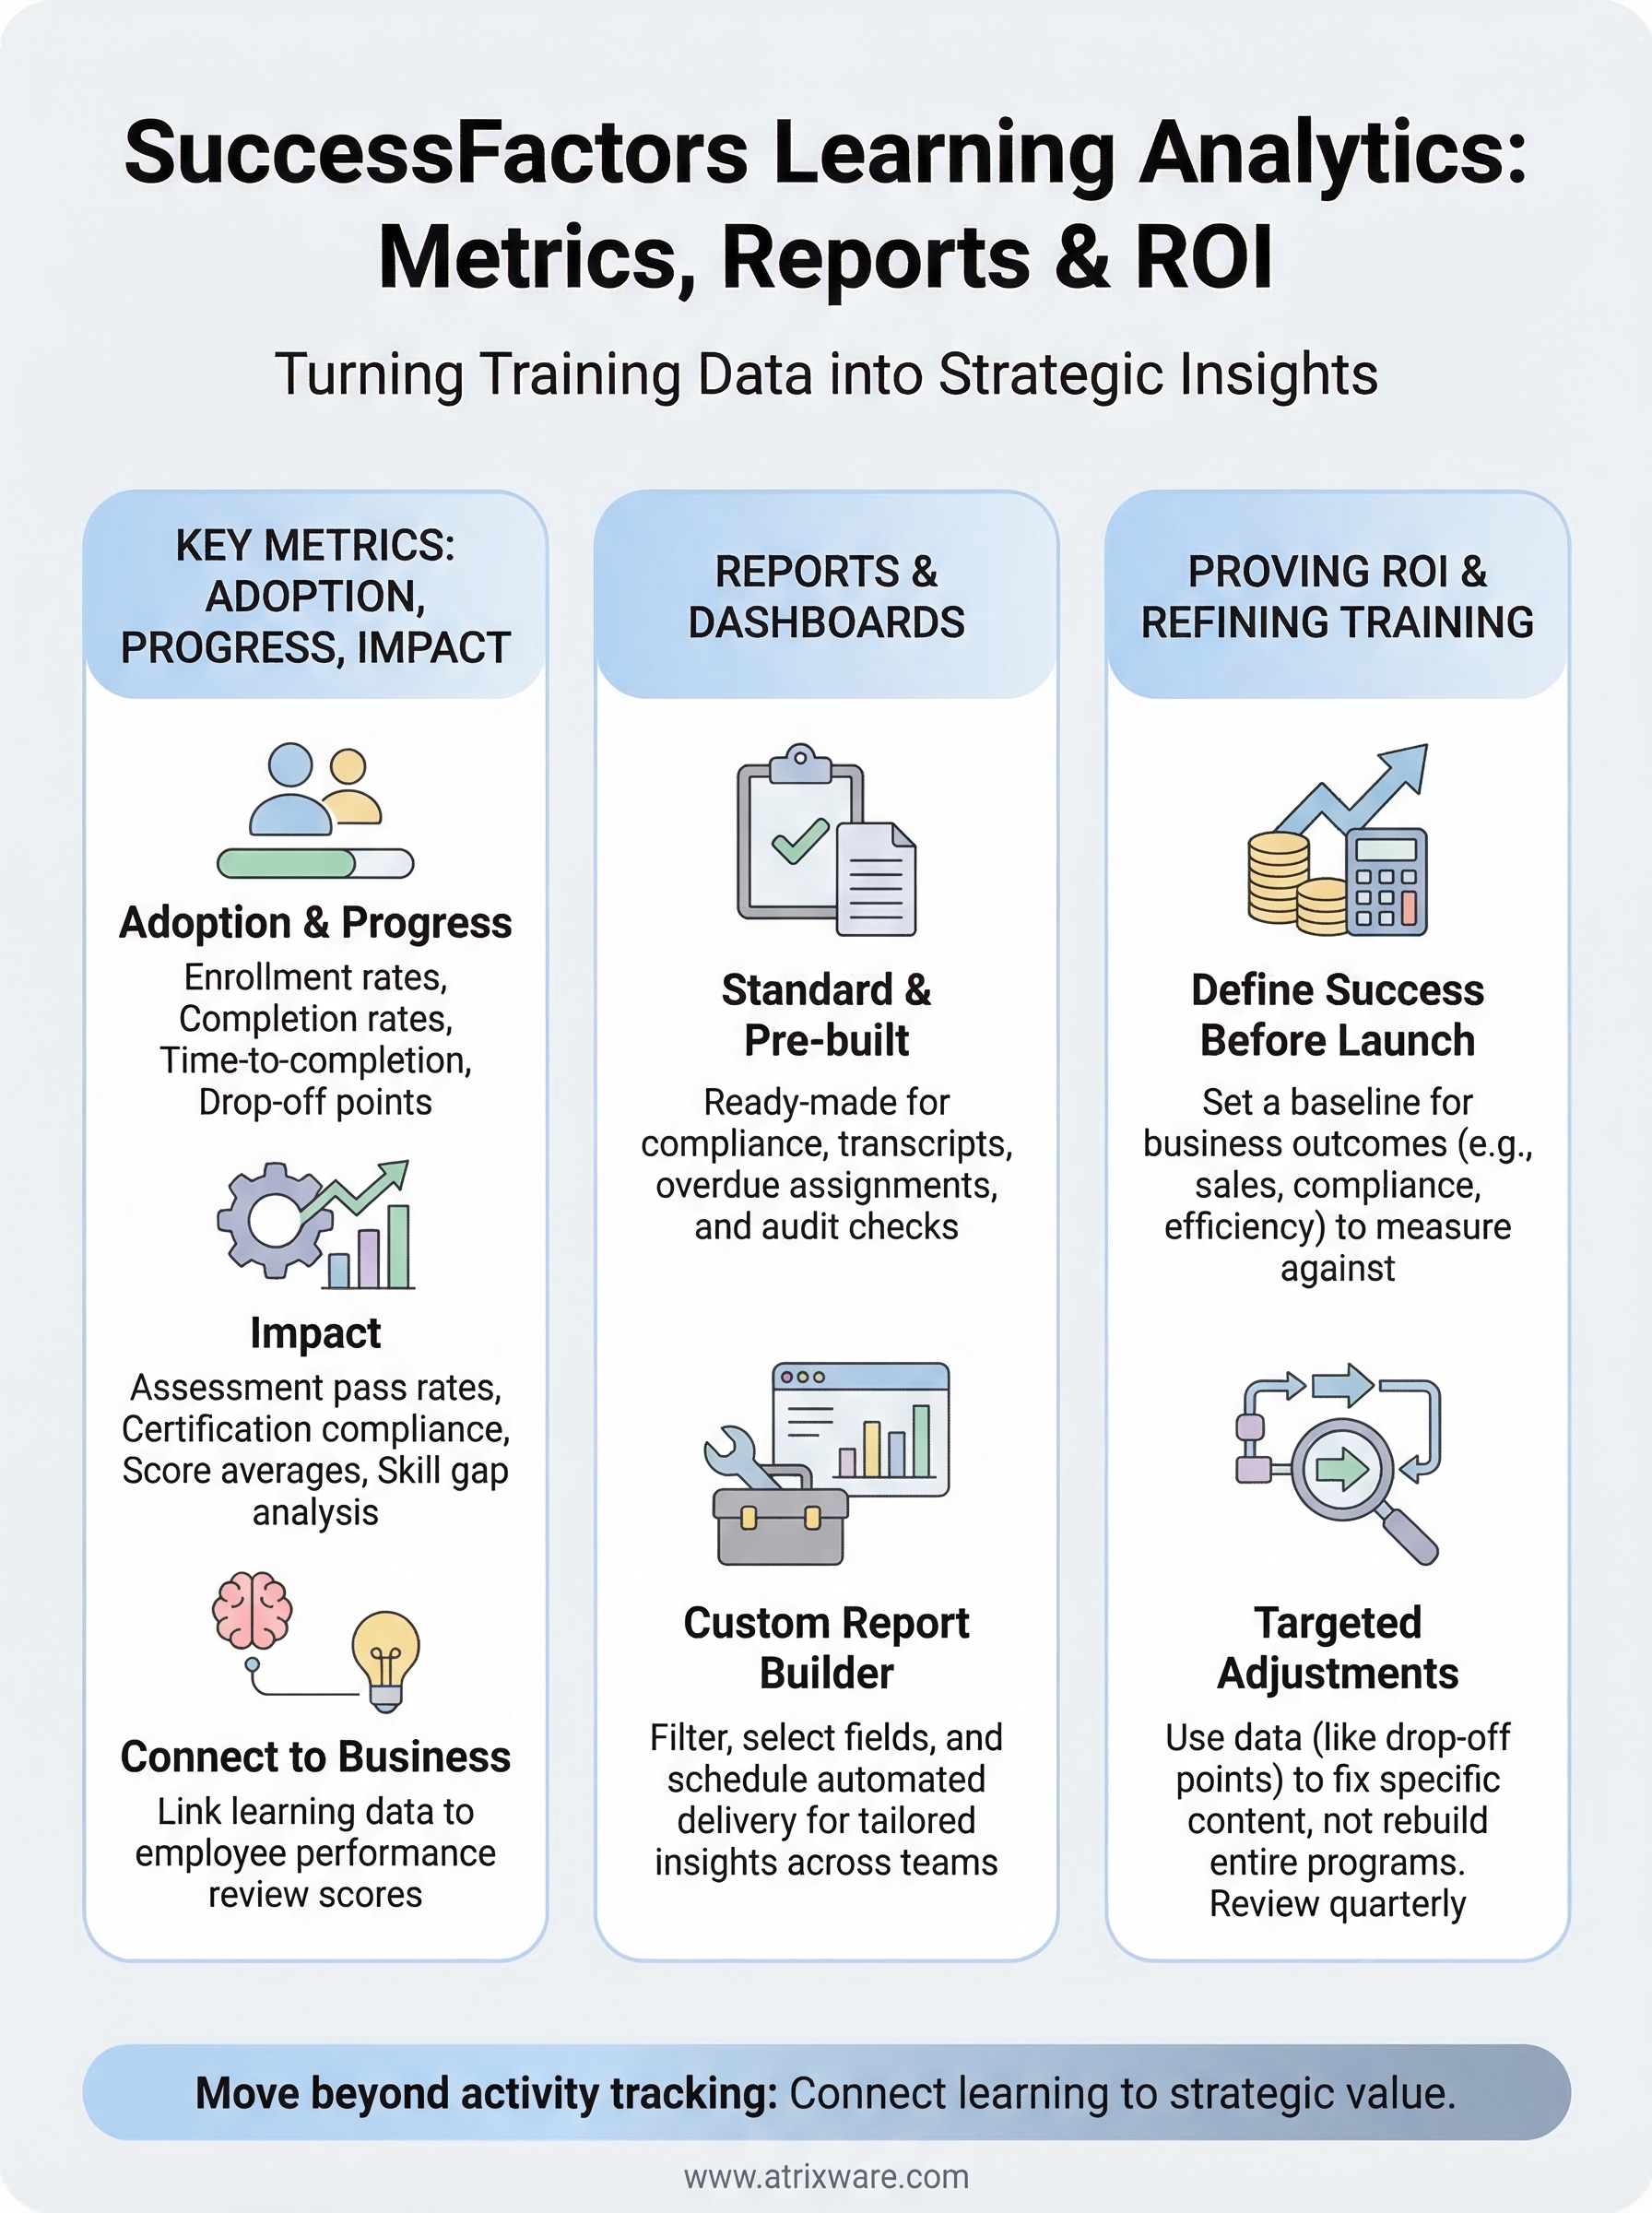
SuccessFactors learning analytics organizes the data you collect into three meaningful categories: adoption (are people actually engaging with training?), progress (are they advancing through it at a reasonable pace?), and impact (is the training producing measurable changes in behavior or performance?). Building your reporting strategy around these three categories gives you a clearer framework than pulling whatever the system surfaces by default.

Tracking every available metric without a specific question in mind produces noise rather than insight.
Adoption and progress metrics
These metrics tell you whether your training program is actually reaching people. Enrollment rates show how many learners started assigned or elective courses, while completion rates reveal how many finished. Time-to-completion adds nuance: if learners consistently take far longer than expected, the course may be too complex or poorly sequenced. You can also track drop-off points within individual courses to pinpoint exactly where learners disengage.
Impact metrics
Impact metrics connect training activity to business-relevant outcomes. Assessment pass rates and average scores confirm whether learners retained the material at a meaningful level. Certification compliance rates track whether required training stays current across teams and departments. When you link these figures to performance review data within SuccessFactors, you can test whether employees who completed specific programs score measurably higher on key competencies.
Reports and dashboards in SuccessFactors Learning
SuccessFactors Learning ships with standard report templates covering completions, assignments, certification status, and assessment scores. These give you a starting point, but knowing how each report type works helps you pull the specific data your stakeholders need rather than running whatever appears by default.

The difference between a useful report and a useless one comes down to whether you defined the question before opening the tool.
Standard and pre-built reports
The system provides pre-built reports for common compliance and administrative tasks, including overdue assignment tracking, transcript history, and curriculum completion summaries. Filter by department, job role, or date range to make them work for both audits and routine progress checks.
Common pre-built report types include:
- Completion and transcript history
- Overdue assignment tracking
- Certification status by team
Custom report builder
When standard templates fall short, SuccessFactors learning analytics includes a custom report builder where you select fields, apply filters, and schedule automated delivery. Cross-object reports pull data from both the Learning module and connected HR records, giving managers one consolidated view instead of merged spreadsheets.
Scheduled reports push recurring data snapshots directly to department heads automatically, reducing the manual effort of tracking training status across each reporting cycle.
How to prove ROI and improve training with data
Proving ROI on training starts with defining what success looks like before you launch a program, not after. If you can’t name a business outcome the training is meant to improve, a completion report won’t help you make the case for continued investment. Set a clear baseline first.
The clearest ROI argument connects a specific training intervention to a measurable shift in performance, sales, or compliance outcomes.
Connecting training costs to business outcomes
SuccessFactors learning analytics lets you pull cost-per-learner figures and set them alongside performance or compliance improvement data. Link training completions to post-training performance review scores to see whether employees who finished a program outperformed those who didn’t. That comparison gives stakeholders a concrete number, not just a completion rate.
Using data to refine your programs
Once you have baseline data, use it to make targeted program adjustments rather than wholesale redesigns. If assessment scores drop below a threshold after a specific module, that signals a content or sequencing problem, not a learner failure. Drop-off data within individual courses identifies exactly where learners disengage, so you fix the specific section rather than rebuilding everything. Reviewing these patterns each quarter keeps your training library current and your budget focused on programs that produce measurable results.
Key takeaways
SuccessFactors learning analytics gives L&D teams a structured way to move past activity tracking and connect training programs to real business outcomes. The platform collects data across completions, assessments, compliance, and time-to-competency, then surfaces that data through pre-built and custom reports you can schedule and filter by role, department, or date range.
Your ability to prove ROI depends on setting a clear baseline before a program launches, not after. Adoption, progress, and impact metrics each answer a different question, and using all three gives you a complete picture of whether training is working. When you tie learning data to performance outcomes, you shift the conversation from cost to value.
If you’re evaluating whether your current system delivers this level of insight, take the LMS readiness quiz to see where you stand and what capabilities to prioritize next.